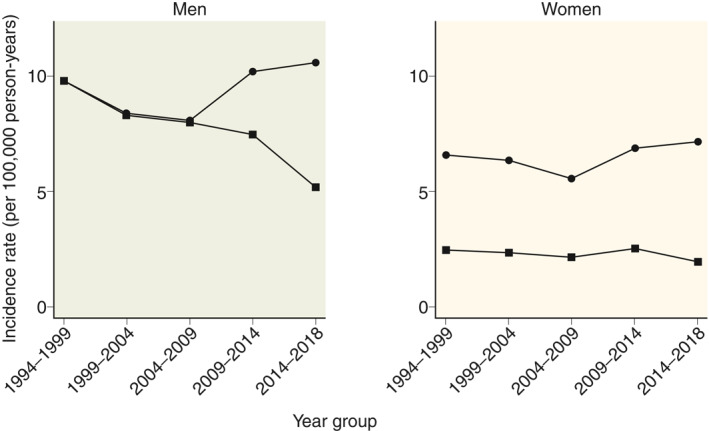
FIGURE 2.

Mean incidence rates (per 100,000 person‐years) of chronic pancreatitis in Denmark from 1994 to 2018, by gender and aetiology. Circles represent nonalcoholic chronic pancreatitis and squares represent alcoholic chronic pancreatitis. Incidence rates standardised to the age distribution in 2014–2018 are shown
