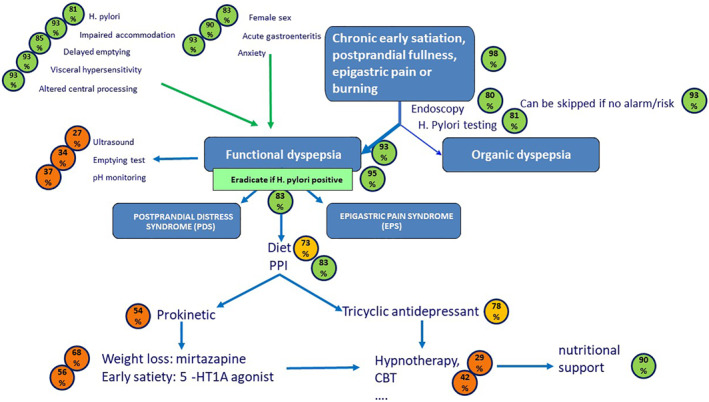
FIGURE 1.

Schematic representation, in an algorithm‐like fashion, of the outcome of the consensus on functional dyspepsia management. The blue arrows depict the diagnostic and therapeutic flow of the patient. Green arrows refer to risk or pathophysiological factors. The circles depict the % of agreement, using a green color for ≥80% consensus, light orange for consensus between 70% and 80%, and dark orange for lower levels of consensus
