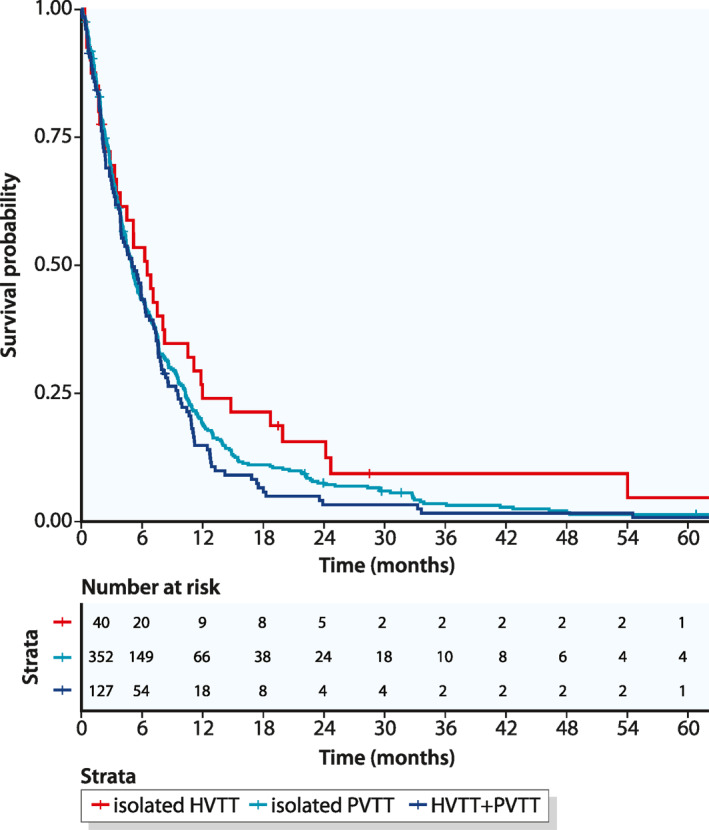
FIGURE 3.

Kaplan – Meier curves of overall survival, beginning at the time of macrovascular invasion and stratified according to the different type of macrovascular invasion. HVTT, hepatic vein tumor thrombosis; PVTT, portal vein tumor thrombosis

Kaplan – Meier curves of overall survival, beginning at the time of macrovascular invasion and stratified according to the different type of macrovascular invasion. HVTT, hepatic vein tumor thrombosis; PVTT, portal vein tumor thrombosis