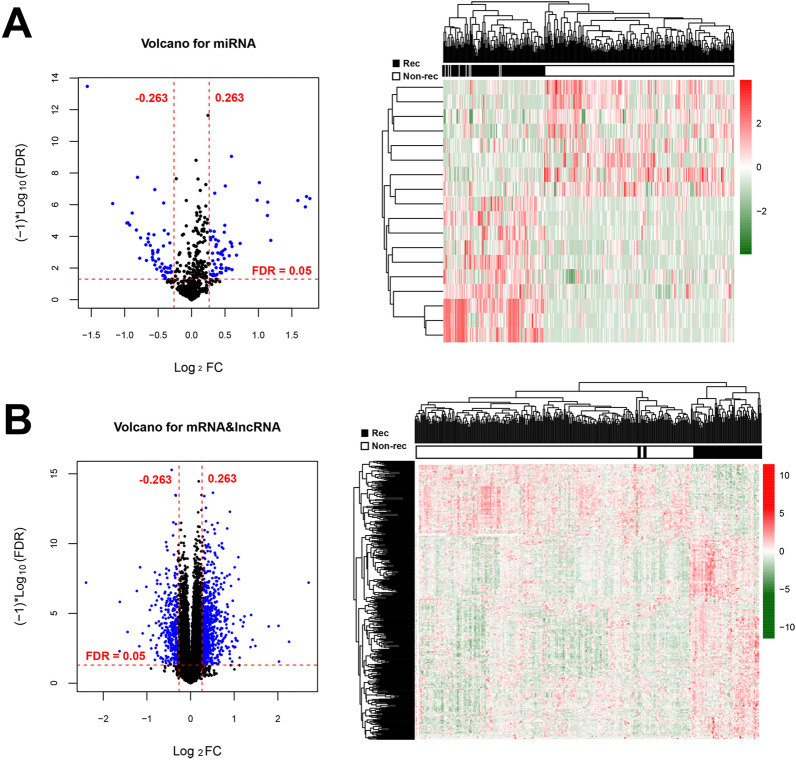
Fig. 1.
Volcano plot and bidirectional hierarchical clustering heatmap. A Left picture: Volcano plot depicting the DEmiRNAs; Blue dots indicate the DEmiRNAs. The red horizontal dotted line indicates FDR < 0.05 and two red vertical dashed lines indicate |log2FC|> 0.263. Right picture: Bidirectional hierarchical clustering heat map based on DEmiRNAs; The white and black samples below represent non-recurrence and recurrence samples, respectively. B Left picture: Volcano plot depicting the DEmRNAs and DElncRNAs; Blue dots indicate the DEmRNAs and DElncRNAs. The red horizontal dotted line indicates FDR < 0.05 and two red vertical dashed lines indicate |log2FC|> 0.263. Right picture: Bidirectional hierarchical clustering heat map based on DEmRNAs and DElncRNAs; The white and black samples below represent non-recurrence and recurrence samples, respectively

