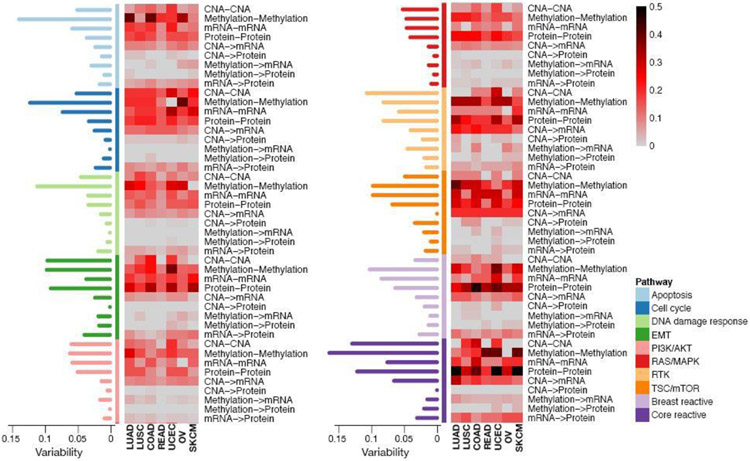
Fig. 5.
Heatmap depicting connectivity score (CS) of the within- and between-layer sub-networks of the estimated mlGGMs across the 7 cancer types and 10 pathways. The scores are indicated on a low-to-high scale (grey-red-black). The standard deviations of the CS values across cancer types are displayed in the barplots.

