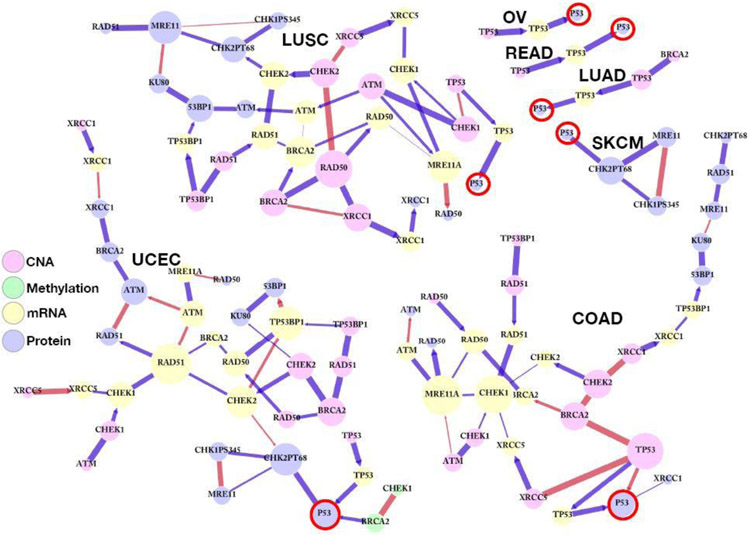
Fig. 6.
Integrative sub-networks for the p53 protein (red circle), inferred from BANS for LUAD, LUSC, COAD, READ, UCEC, OV, and SKCM. Each connected component includes all nodes that are connected to the p53 protein by any lengths of paths, including both undirected and directed edges for each cancer. The colors of edges indicate the inferred signs of the edges: negative (red) and positive (blue). The sizes of nodes and the widths of edges are weighted by their degrees and posterior edge inclusion probabilities, respectively.

