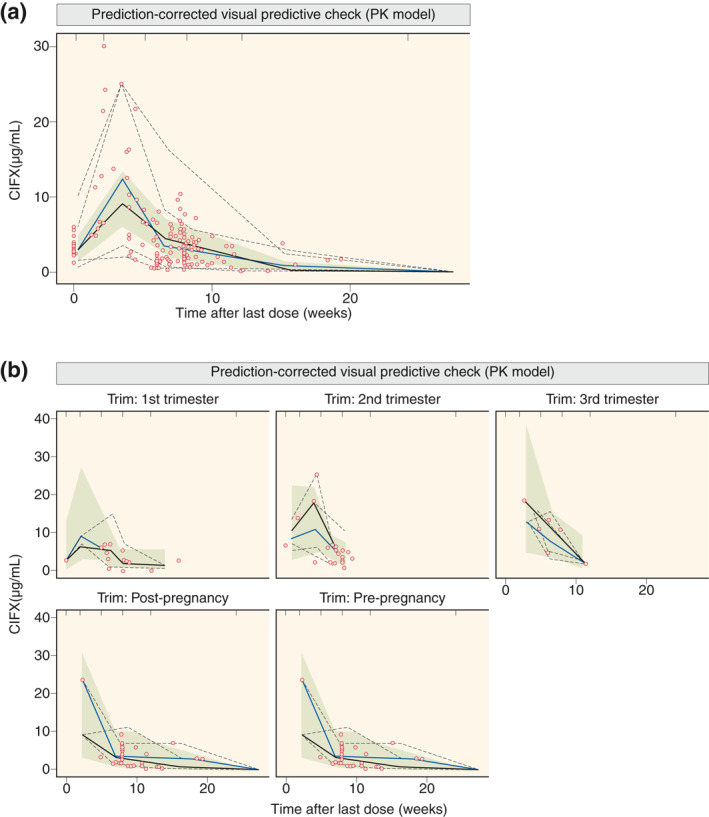
FIGURE 2.

Prediction‐corrected visual predictive check for the final pharmacokinetic (PK) model for all data (a) and per (non)pregnancy phase (b). Full lines are median and dashed lines are the 5th and 95th percentile of observations (black lines) and simulations (gray lines); the gray area denotes the 90% confidence interval around the median of the simulated data; dots denote observations
