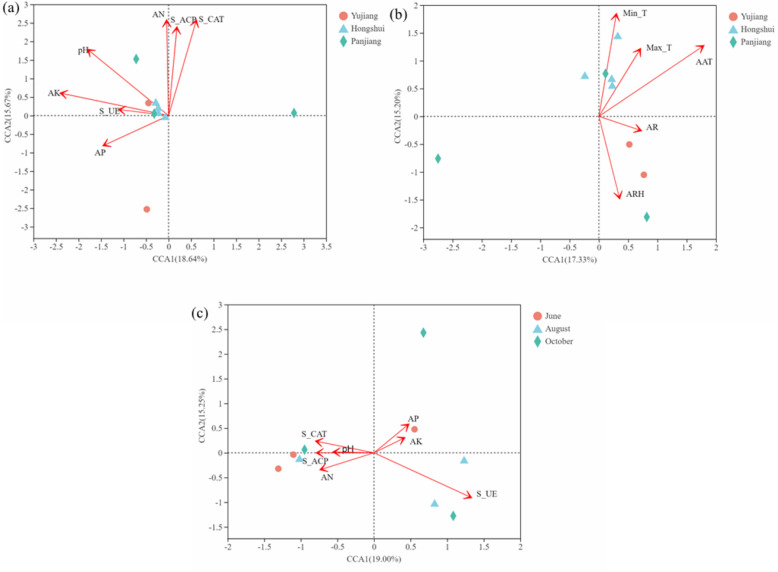
Fig. 3.
Canonical Correlation Analysis (CCA). a CCA, small watersheds of soil; b CCA, small watersheds of climate, maximum temperature (Max-T), minimum temperature (Min-T), annual average temperature (AAT), average relative humidity (ARH), annual rainfall (AR); c CCA fruit periods. The red arrows represent quantitative environmental factors. Arrow length represents the degree of influence of environmental factors on species data. The distance from the projection point to the origin represents the relative influence of environmental factors on the distribution of the sample community

