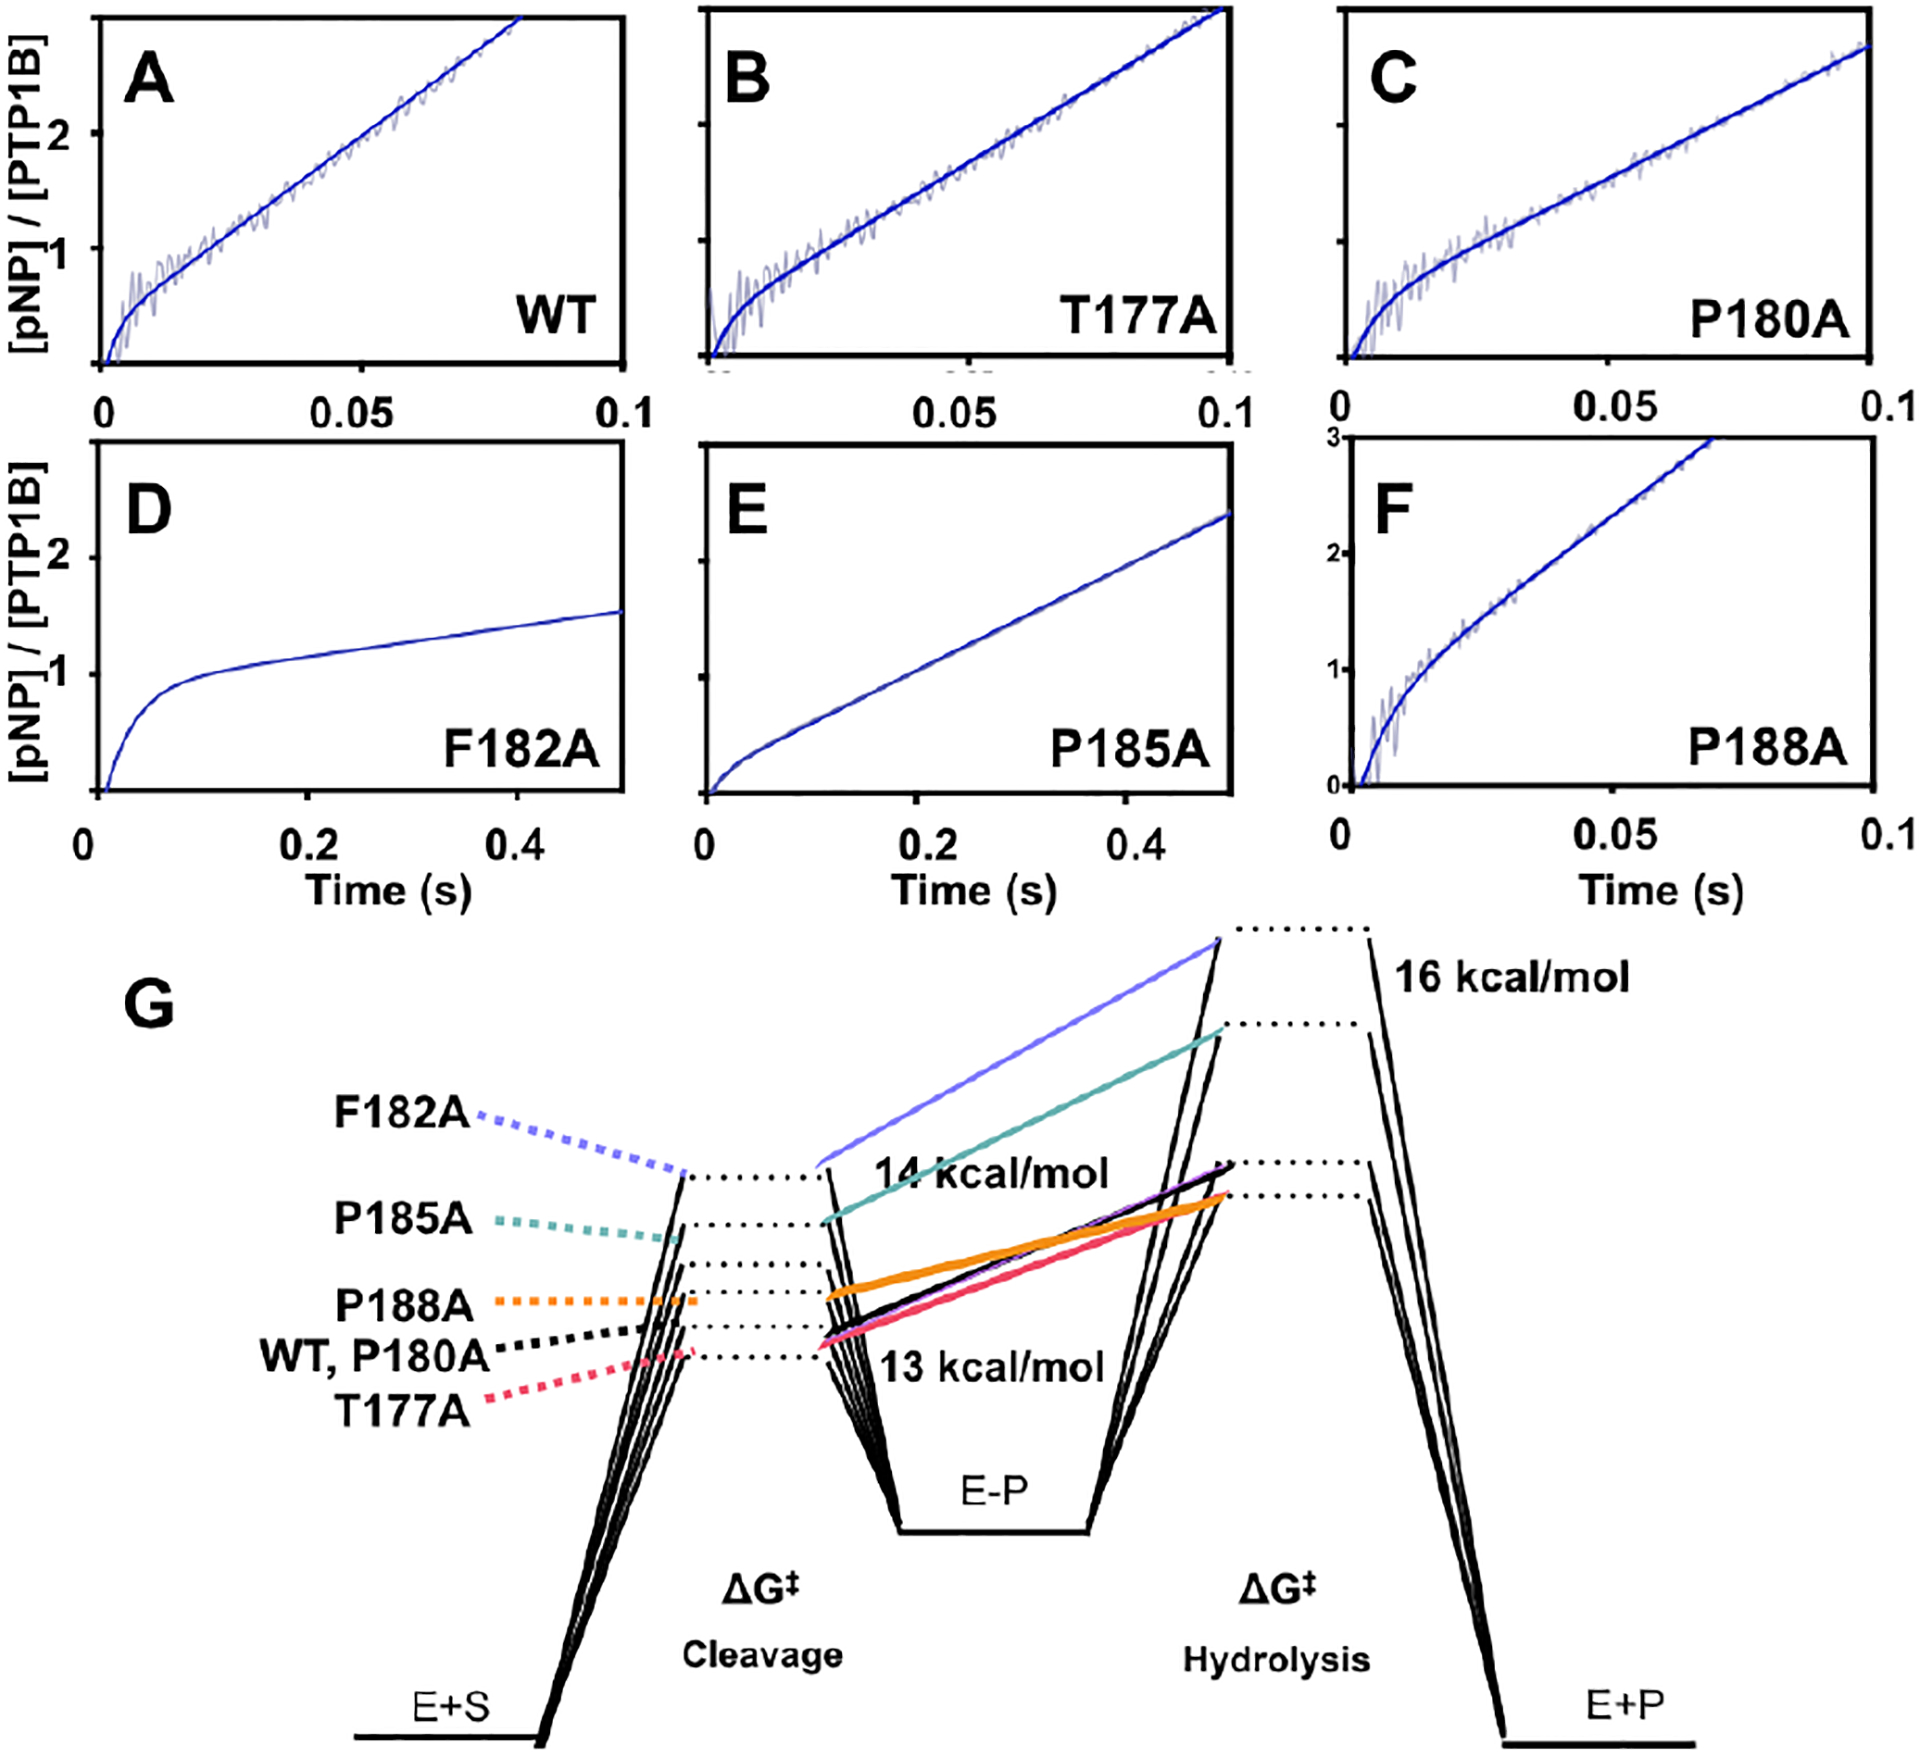
Figure 7–

A-F) Pre-steady state kinetics of the dephosphorylation of p-NPP at 3.5°C. The average of 6 traces was averaged over a window size of 10, is shown in light grey, the fits of each curve is shown in dark blue. G) Reaction energy diagram mapping transition states of the cleavage and hydrolysis steps.
