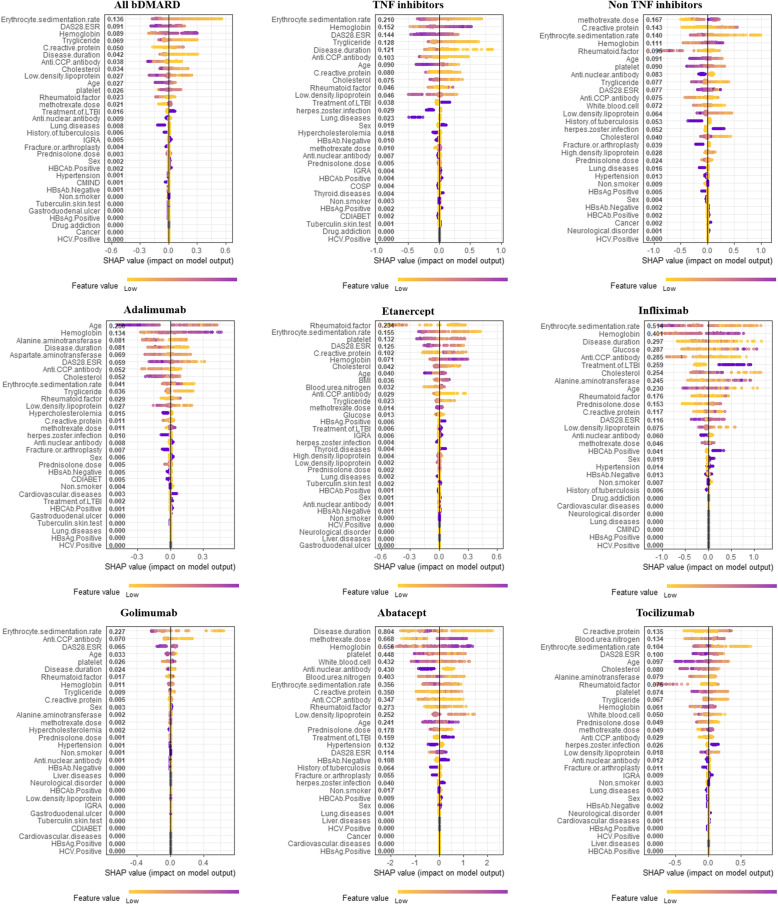
Fig. 3.
Shapley plots for bDMARDs. Shapley plots show the SHAP values in the order of the important variables that contribute to remission. The feature values change from light (low) to dark (high) for each variable. For age, for example, the lighter colors represent lower age, whereas the darker colors represent higher age. For adalimumab, increasing (positive) SHAP values with lighter colors indicate that lower ages are strongly related to remission, whereas decreasing (negative) SHAP values with darker colors indicate that higher ages are strongly related to remission failure. Therefore, linear changes in the feature values are expressed in color, and the SHAP values (impact on model output) indicate closer to remission or remission failure based on the feature values. DAS, disease activity score; ESR, erythrocyte sedimentation rate; LTBI, latent tuberculosis infection; IGRA, interferon-gamma release assay; HBcAb, hepatitis B core antibody; CMIND, psychiatric comorbidity; HBsAb, hepatitis B surface antibody; HBsAg, hepatitis B surface antigen; HCV, hepatitis C virus; COSP, osteoporosis; CDIABET, diabetes mellitus and its complications; BMI, body mass index

