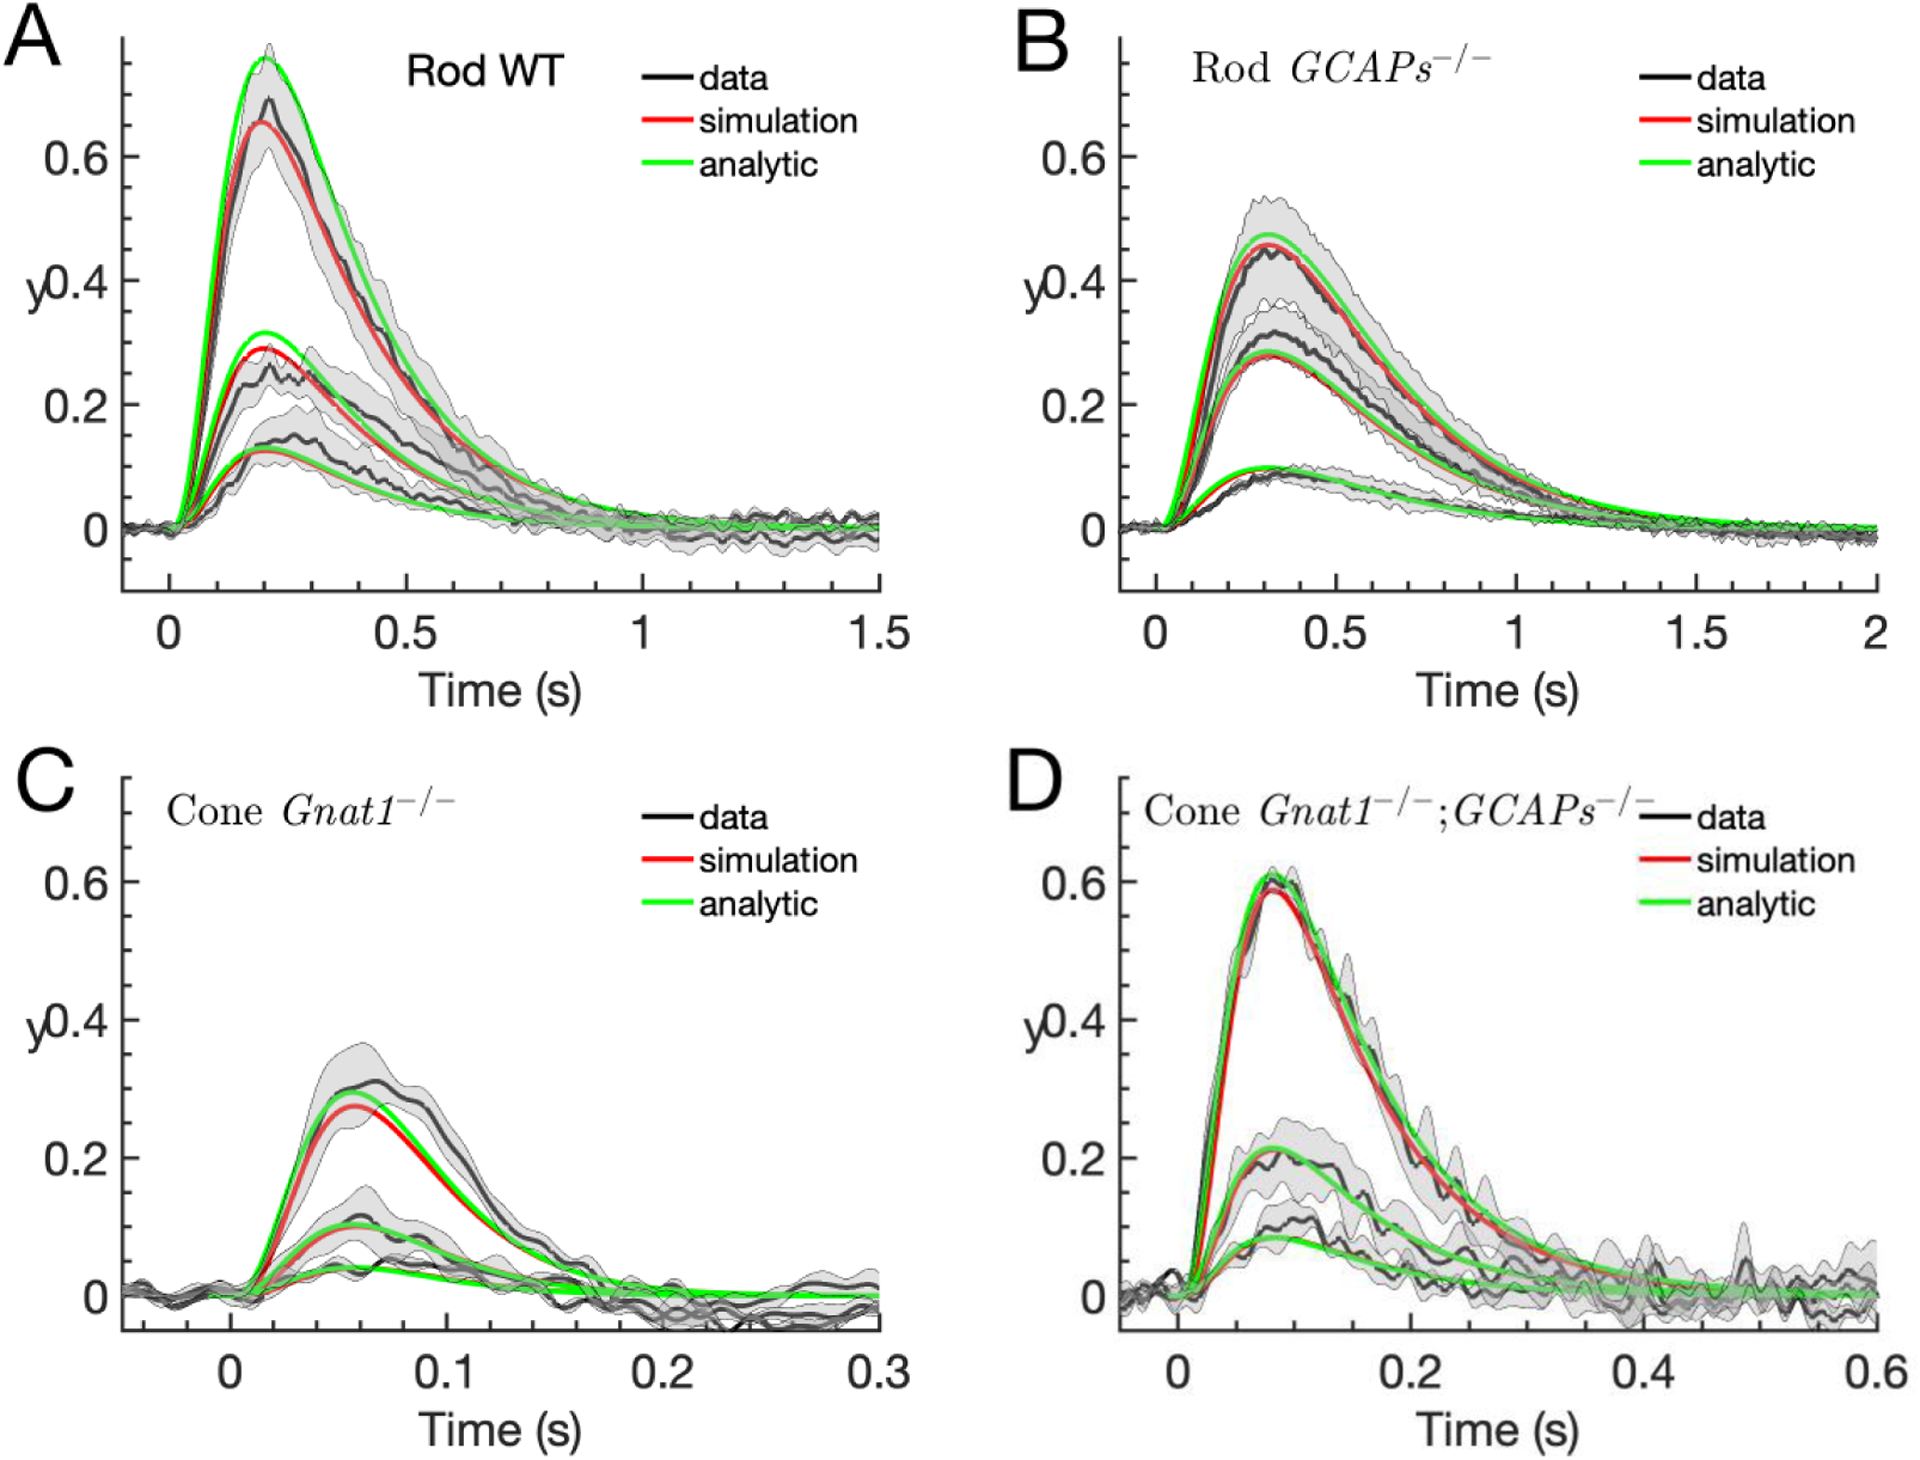
Figure 1.

Log-transform of dim-flash responses. Experimental current recordings from mouse rods and cones have been normalized to their corresponding steady-state current in darkness Id, with (such that Î = 1 in darkness), and then the log-transform of these normalized currents was computed according to y(t) = −lnÎ(t) (black curves). The experimental data is compared to simulations of y(t) (red curves) and the analytic results computed with Eq. 1 and Eq. 9 and parameters from Table 2. The expected number of pigment isomerizations are (1.8, 4.3, 10.3) for (A), (0.6, 1.6, 2.7) for (B), and (86, 220, 620) for (C-D). Flash durations are 10ms in (A), 20ms in (B) and 5ms in (C, D). (A) The rod WT data is computed with mean responses of 7 WT rods. (B) The rod GCAPs−/− data is computed with mean responses of 5 rods from Chen et al. (2010c). (C) The Cone Gnat1−/− (equivalent to WT or control, see text) data is obtained with responses from 3 cones. (D) The cone Gnat1−/−;GCAPs−/− (equivalent to cone GCAPs−/−, see text) shows mean responses from 3 cones.
