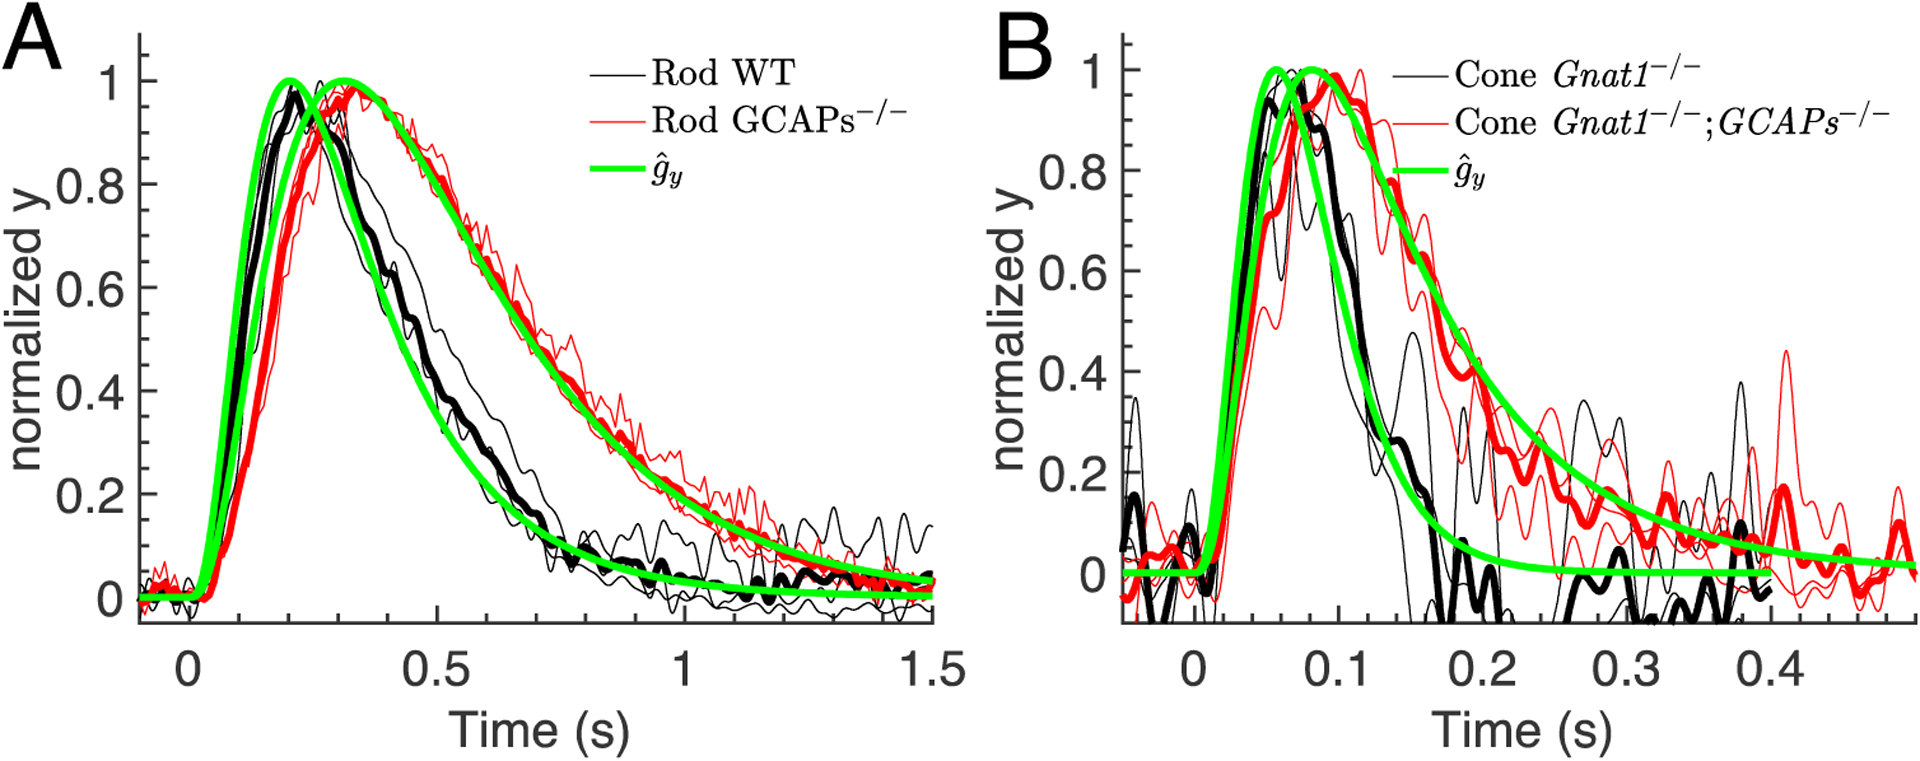
Figure 2.

Waveform of dim-flash responses. The rod and cone waveforms from Fig. 1 (thin continuous lines) were used to compute an averaged waveform (thick continuous lines). The averaged waveform is compared to the analytic result computed with Eq. 9 and parameters from Table 2 (green lines). (A) Waveforms for rod WT (black curves) and GCAPs−/− data (red curves) together with the corresponding analytic results (green curves). (B) Waveforms for cone WT (black curves) and GCAPs−/− data (red curves) together with the corresponding analytic results (green curves).
