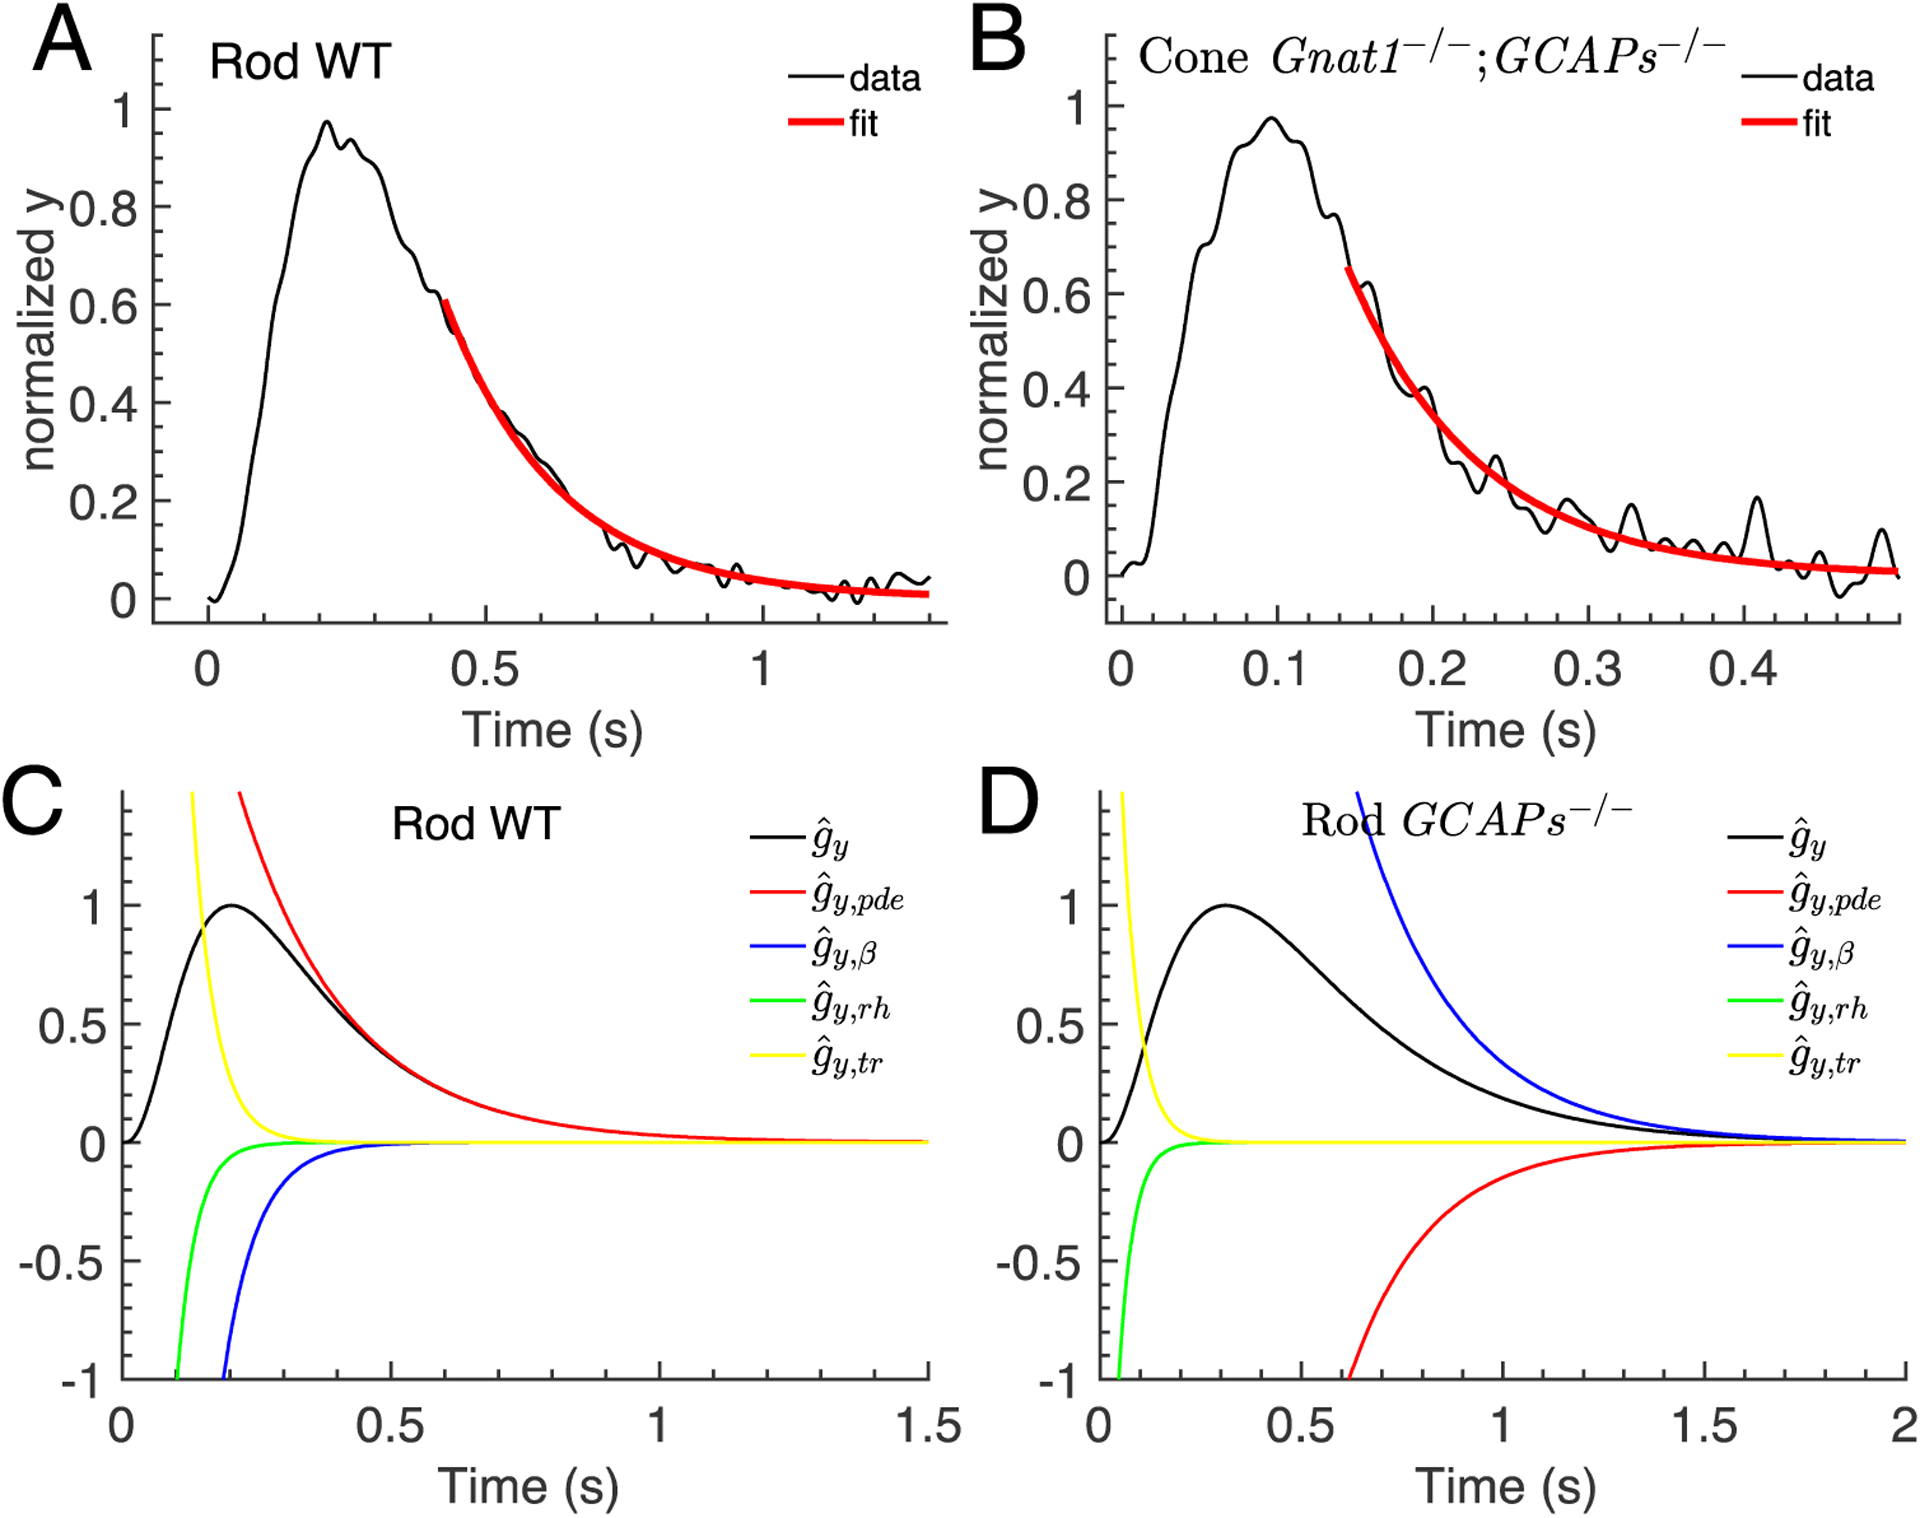
Figure 4.

Recovery phase of the waveform. (A-B) The recovery phase of the averaged waveform data for WT rod and Gnat1−/−;GCAPs−/− cone from Fig. 2 (black curves) were fitted with a single exponential function to extract the recovery rates constants μrec (red curves). The fitted values are μrec = 4.9s−1 for WT rod, and μrec = 11.9−1 for Gnat1−/−;GCAPs−/− cone. (C-D) The curves show the individual single exponentials related to rhodopsin decay, transducin decay, PDE decay and the cyclase rate constant β that contribute to the waveform computed with Eq. 9 for a WT rod (C) and a GCAPs−/− rod (D) .
