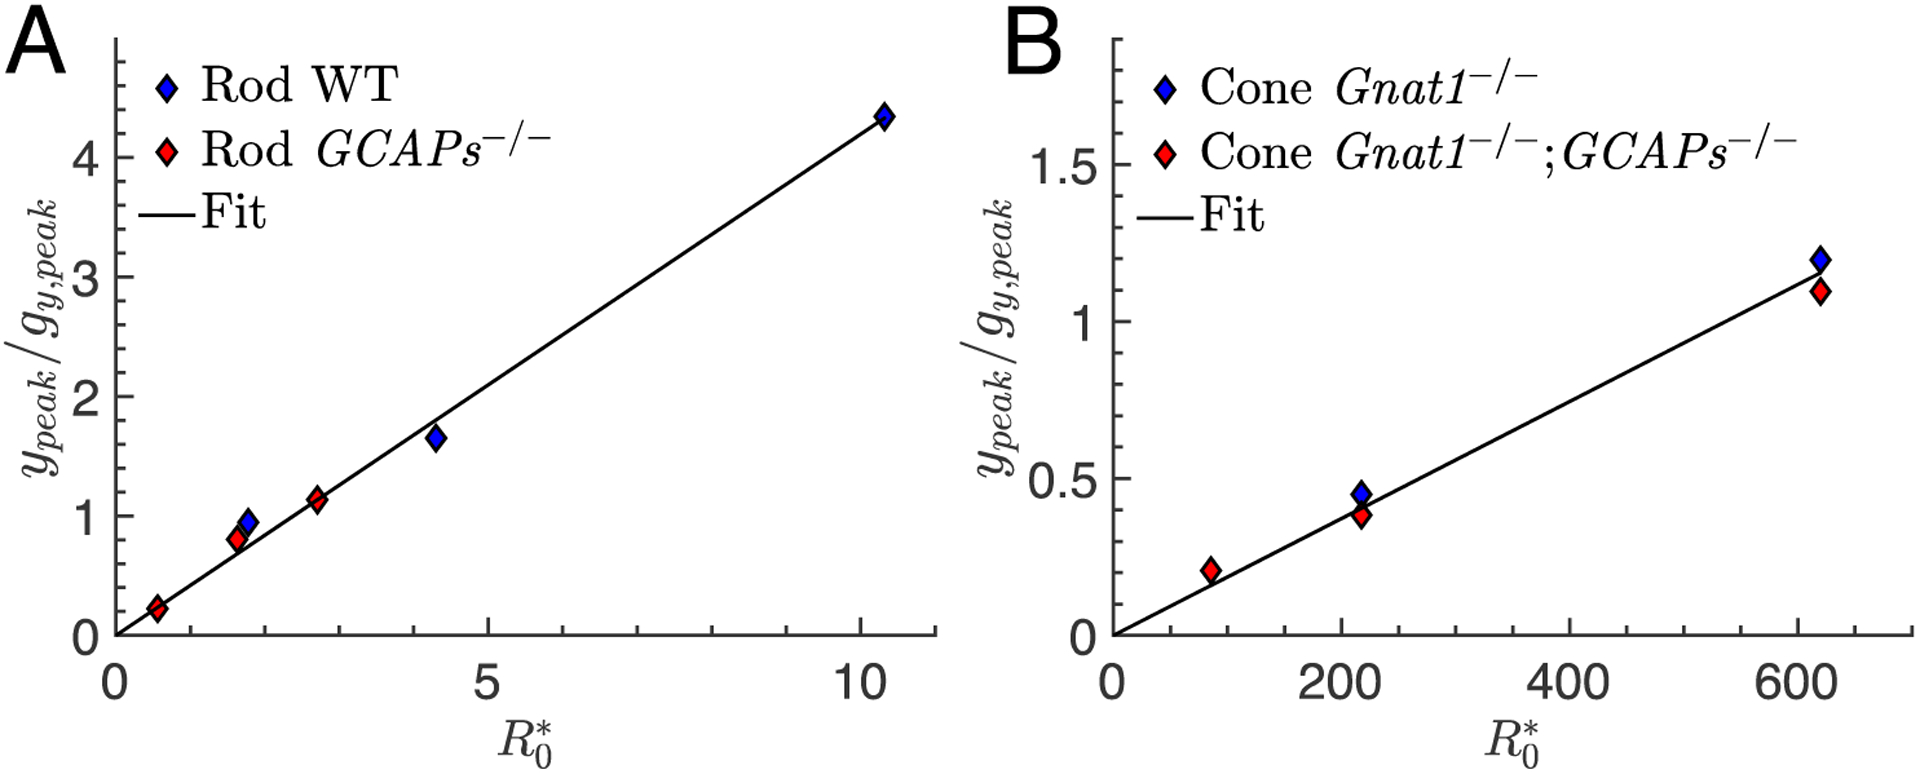
Figure 5.

Estimation of the gain ξ from the peak amplitudes of dim-flash responses. (A) The peak amplitudes ypeak of the log-normal data for rods shown in Fig. 1 A–B together with gy,peak computed with Eq. 1 and parameters from Table 2 are used to calculate for WT (blue diamonds) and GCAPs−/− rod (red diamonds), and then plotted against the number of isomerizations specified in Fig. 1. The black curve is a linear fit to the combined datapoints with slope ξ = 0.42. (B) Same procedure as in (A) but for cones. The linear fit gives ξ = 0.0019.
