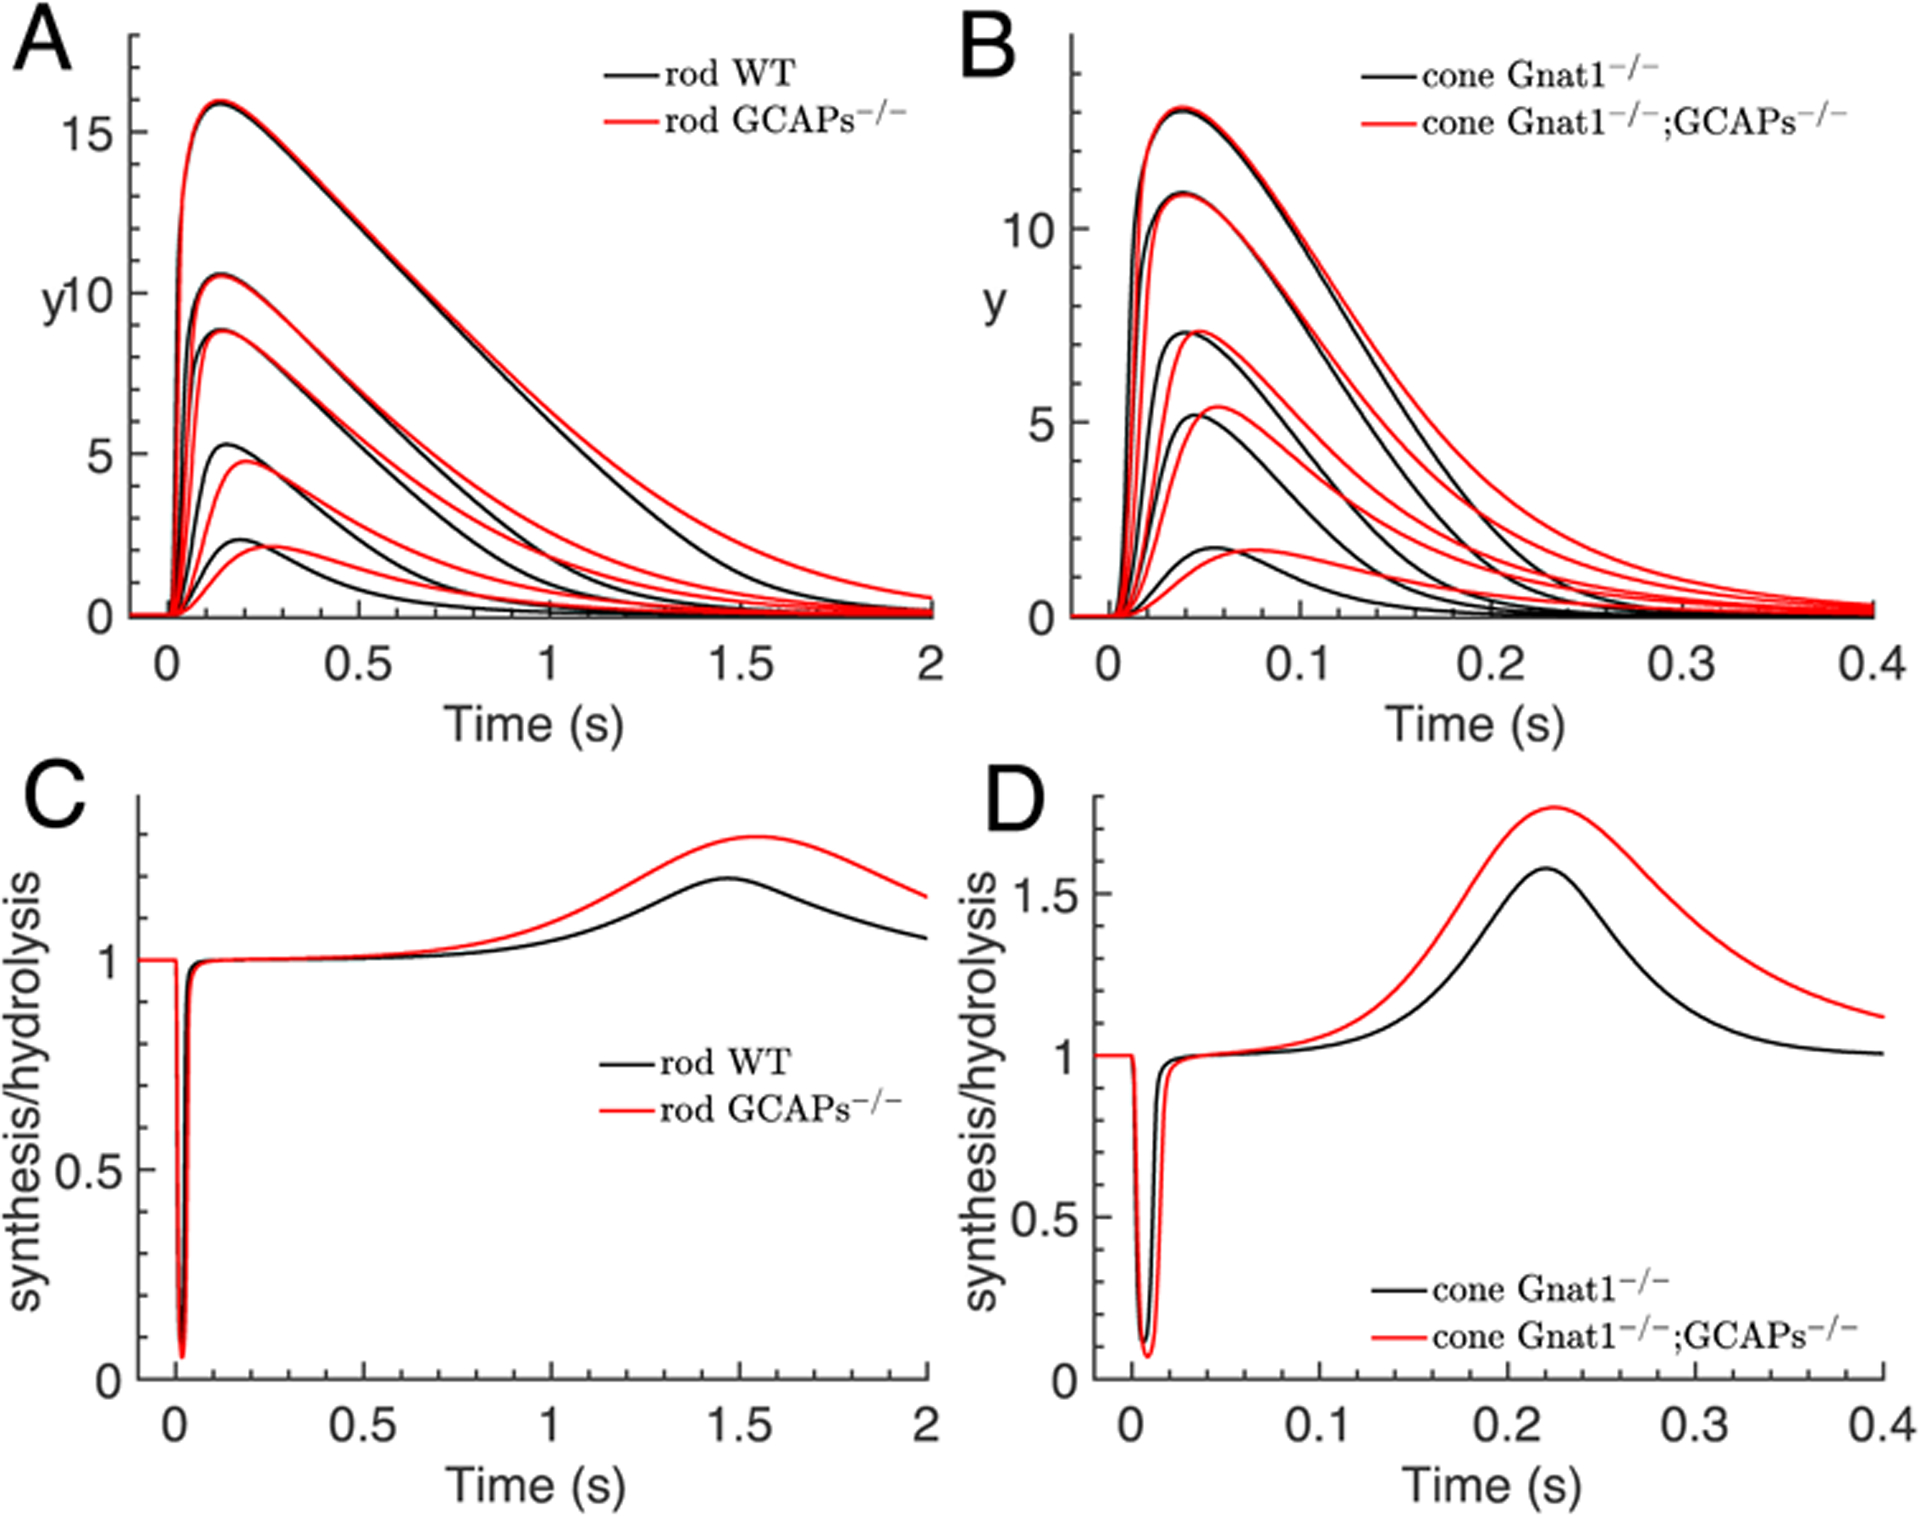
Figure 6.

Simulations of saturating flash responses for rods and cones. The number of isomerizations that were used for the simulations are: (A) WT rod (40,140,600,1200,10000), GCAPs−/− rod (15,50,250,500,4500); (B) Gnat1−/− cone 103x(4.55,1.95,45.5,19.5,455), Gnat1−/−;GCAPs−/− cone 103x(1.95,9.75,19.5,78,195). (A) Comparison of the dynamics of the log-normal y(t) computed with Eq. 1 for saturating flashes for WT (black) and GCAPs−/− rods (red). Flash intensities for WT and GCAPs−/− rods are not the same but were chosen to obtain similar peak amplitudes in order to facilitate the comparison of the kinetics. Parameters are from Table 2. (B) Same procedure as in (A) but for cones. (C) The time course of the ratio r of the rod cGMP synthesis to hydrolysis rate (Eq. 14) for the two strongest flashes in (A) is depicted. (D) Same procedure as in (C) but for cone.
