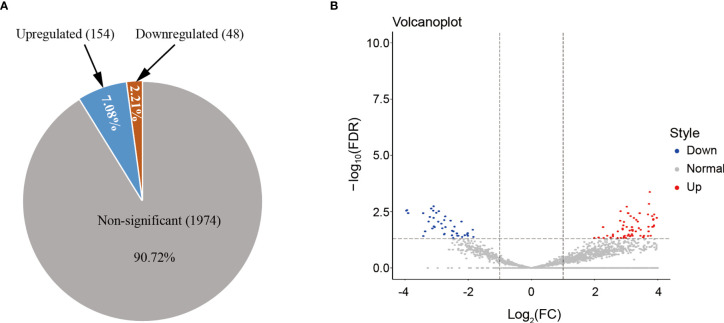
Figure 2.
(A) HS altered the miRNA expression patterns of hepatocyte-derived EVs, as analyzed using NGS. The number and proportion of differentially regulated (upregulated, downregulated, and non-significant) EV miRNAs isolated from HS compared with the control (n = 3 samples/group). Numbers indicate proportions. Data base: Homo Sapiens. (B) Volcano plot representing the miRNA fold-change and RNA intensity in the HS and control hepatocyte EVs. X-axis shows miRNA fold-change (HS/Control, log2), whereas Y-axis depicted the summary of RNA intensity (LFQ intensity, lg).

