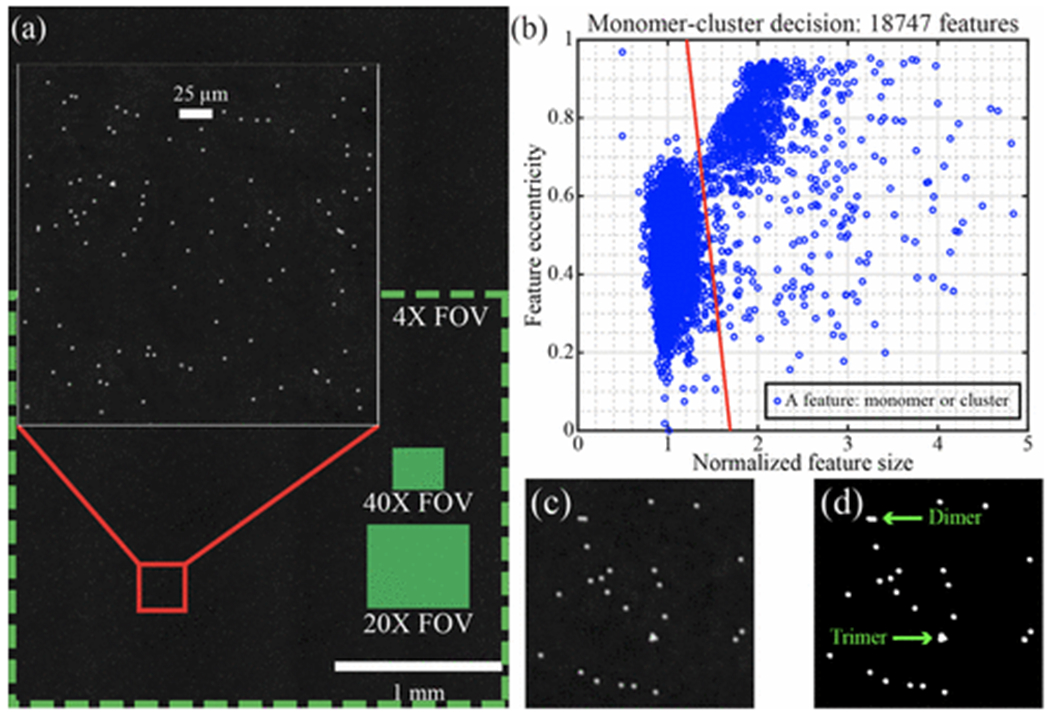
Figure 4:

Quantifying agglutination. (a) Full FOV image of 2-μm beads undergoing Brownian motion. The large inset is a zoomed region demonstrating high SNR imaging. Green boxes show the fields of view for typical conventional microscope objectives. (b) Scatter plot of a single sample with 18747 features, exhibiting a clear monomer-cluster boundary (red line). (c) A small reconstructed region before thresholding. (d) The same region after binary thresholding.
