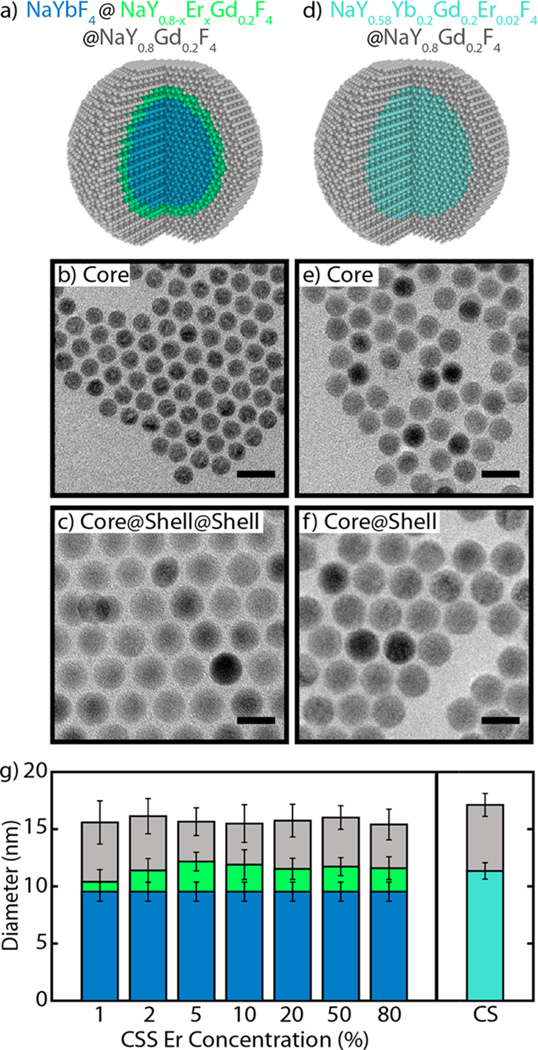
Figure 1.
Schematics, micrographs, and size information on UCNPs. (a) Schematic of the core–shell–shell (CSS) UCNP and TEM micrographs of (b) the starting core and (c) the final CSS UCNPs. (d) Schematic of the core–shell (CS) UCNP and TEM micrographs of (e) the starting core and (f) the final CS UCNPs. All scale bars are 20 nm. (g) Average diameters of the 8 samples compared in this work: 7 CSS samples of different Er3+ doping and 1 CS structure. Core, core–shell, and core–shell–shell diameters shown as blue, green, and gray, respectively, for the CSS structure; core and core–shell diameters shown as teal and gray, respectively, for the CS structure. Error bars represent the standard deviation of the size measurement (N ≥ 700 nanoparticles).

