Figure 2.
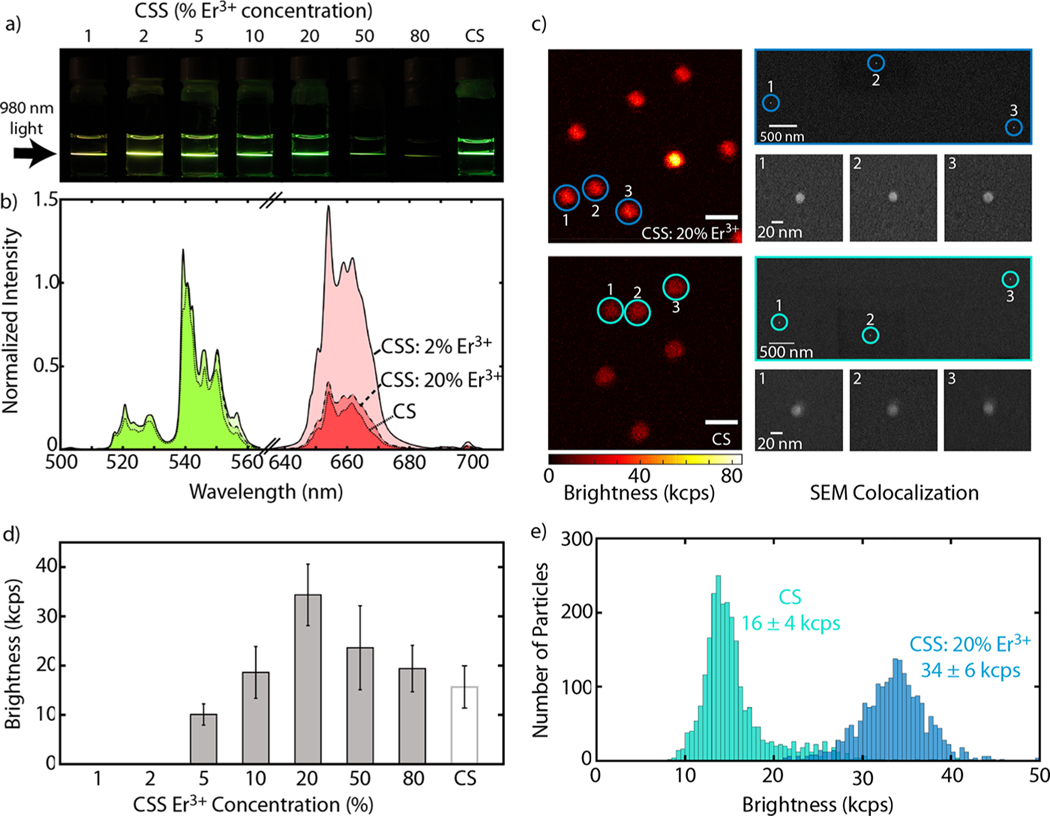
Ensemble and single particle upconversion characterization of CSS and CS structures. (a) Digital images showing upconversion luminescence of UCNPs suspended in hexanes when illuminated with a 980 nm diode laser. (b) Representative upconversion spectra, normalized to the same peak at 540 nm, comparing the CSS structure doped with 2% Er3+ and 20% Er3+ and the CS structure. Here, green emission is colored in green and similarly red emission is colored in red. Emission spectra collected under 980 nm illumination at 70 W/cm2 for UCNPs suspended in hexanes. (c) Single particle measurements for CSS: 20% Er3+ (top) and CS (bottom) structures collected using a scanning confocal microscope with a Nikon 60× oil objective (NA 1.49) and a 976 nm fiber coupled laser at 500 kW/cm2. Scale bars are 2 μm for both confocal images. Corresponding colocalization of particles using scanning electron microscopy (SEM) on right. Scale is identical for all SEM images. (d) Average single particle brightness for all 8 samples; note that 1 and 2% Er3+ doped CSS samples were not bright enough to be measured. Error bars represent the standard deviation of the measurement (N ≥ 450 nanoparticles). (e) Single particle brightness comparison of CS structure and CSS: 20% Er3+.

