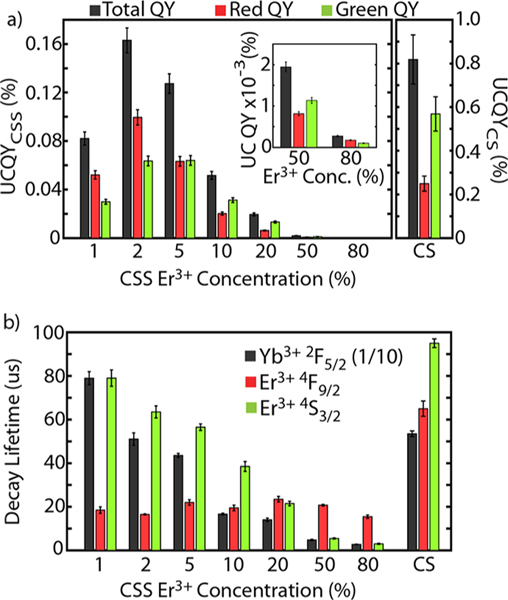
Figure 3.
Upconversion quantum yield and lifetime characterization of CSS and CS samples. (a) Total, red, and green upconversion quantum yield data for CSS structure and CS structure taken under 980 nm illumination at 70 W/cm2. 50 and 80% Er3+ doped CSS data shown in inset for visibility. Note that CSS sample data is plotted on a different y-axis than CS data. (b) Comparison of decay lifetimes for Yb3+2F5/2 emission after 980 nm excitation (note that these values are scaled by a factor of 1/10 so all lifetimes can be plotted on the same scale), red Er3+4F9/2 emission after 649 nm excitation, and green Er3+4S3/2 emission after 520 nm excitation.

