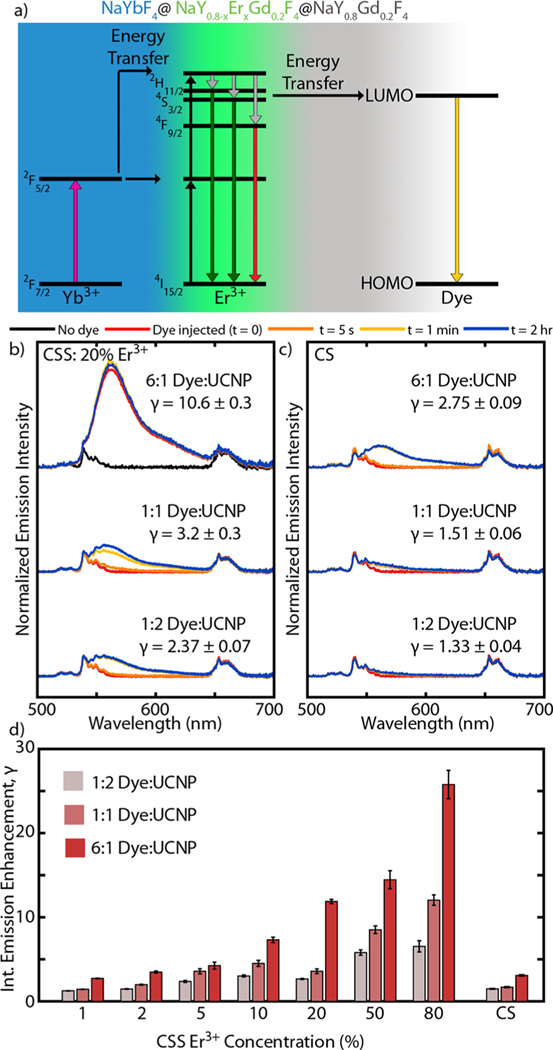
Figure 4.
ATTO 542 dye emission enhancement. (a) Schematic energy diagram showing energy transfer from Er3+ to lowest unoccupied molecular orbital (LUMO) of dye, leading to dye emission. Normalized emission intensity of (b) CSS: 20% Er3+ and (c) CS structures at the three concentrations of dye investigated. Time traces of spectra shown prior to adding dye, immediately after adding dye, 5 s after, 1 min after, and 2 h after. Included gamma (γ) values report the integrated emission enhancement after adding the dye. (d) Summary of the integrated emission enhancement (γ) for all samples at the three dye concentrations.

