
Figure 3.
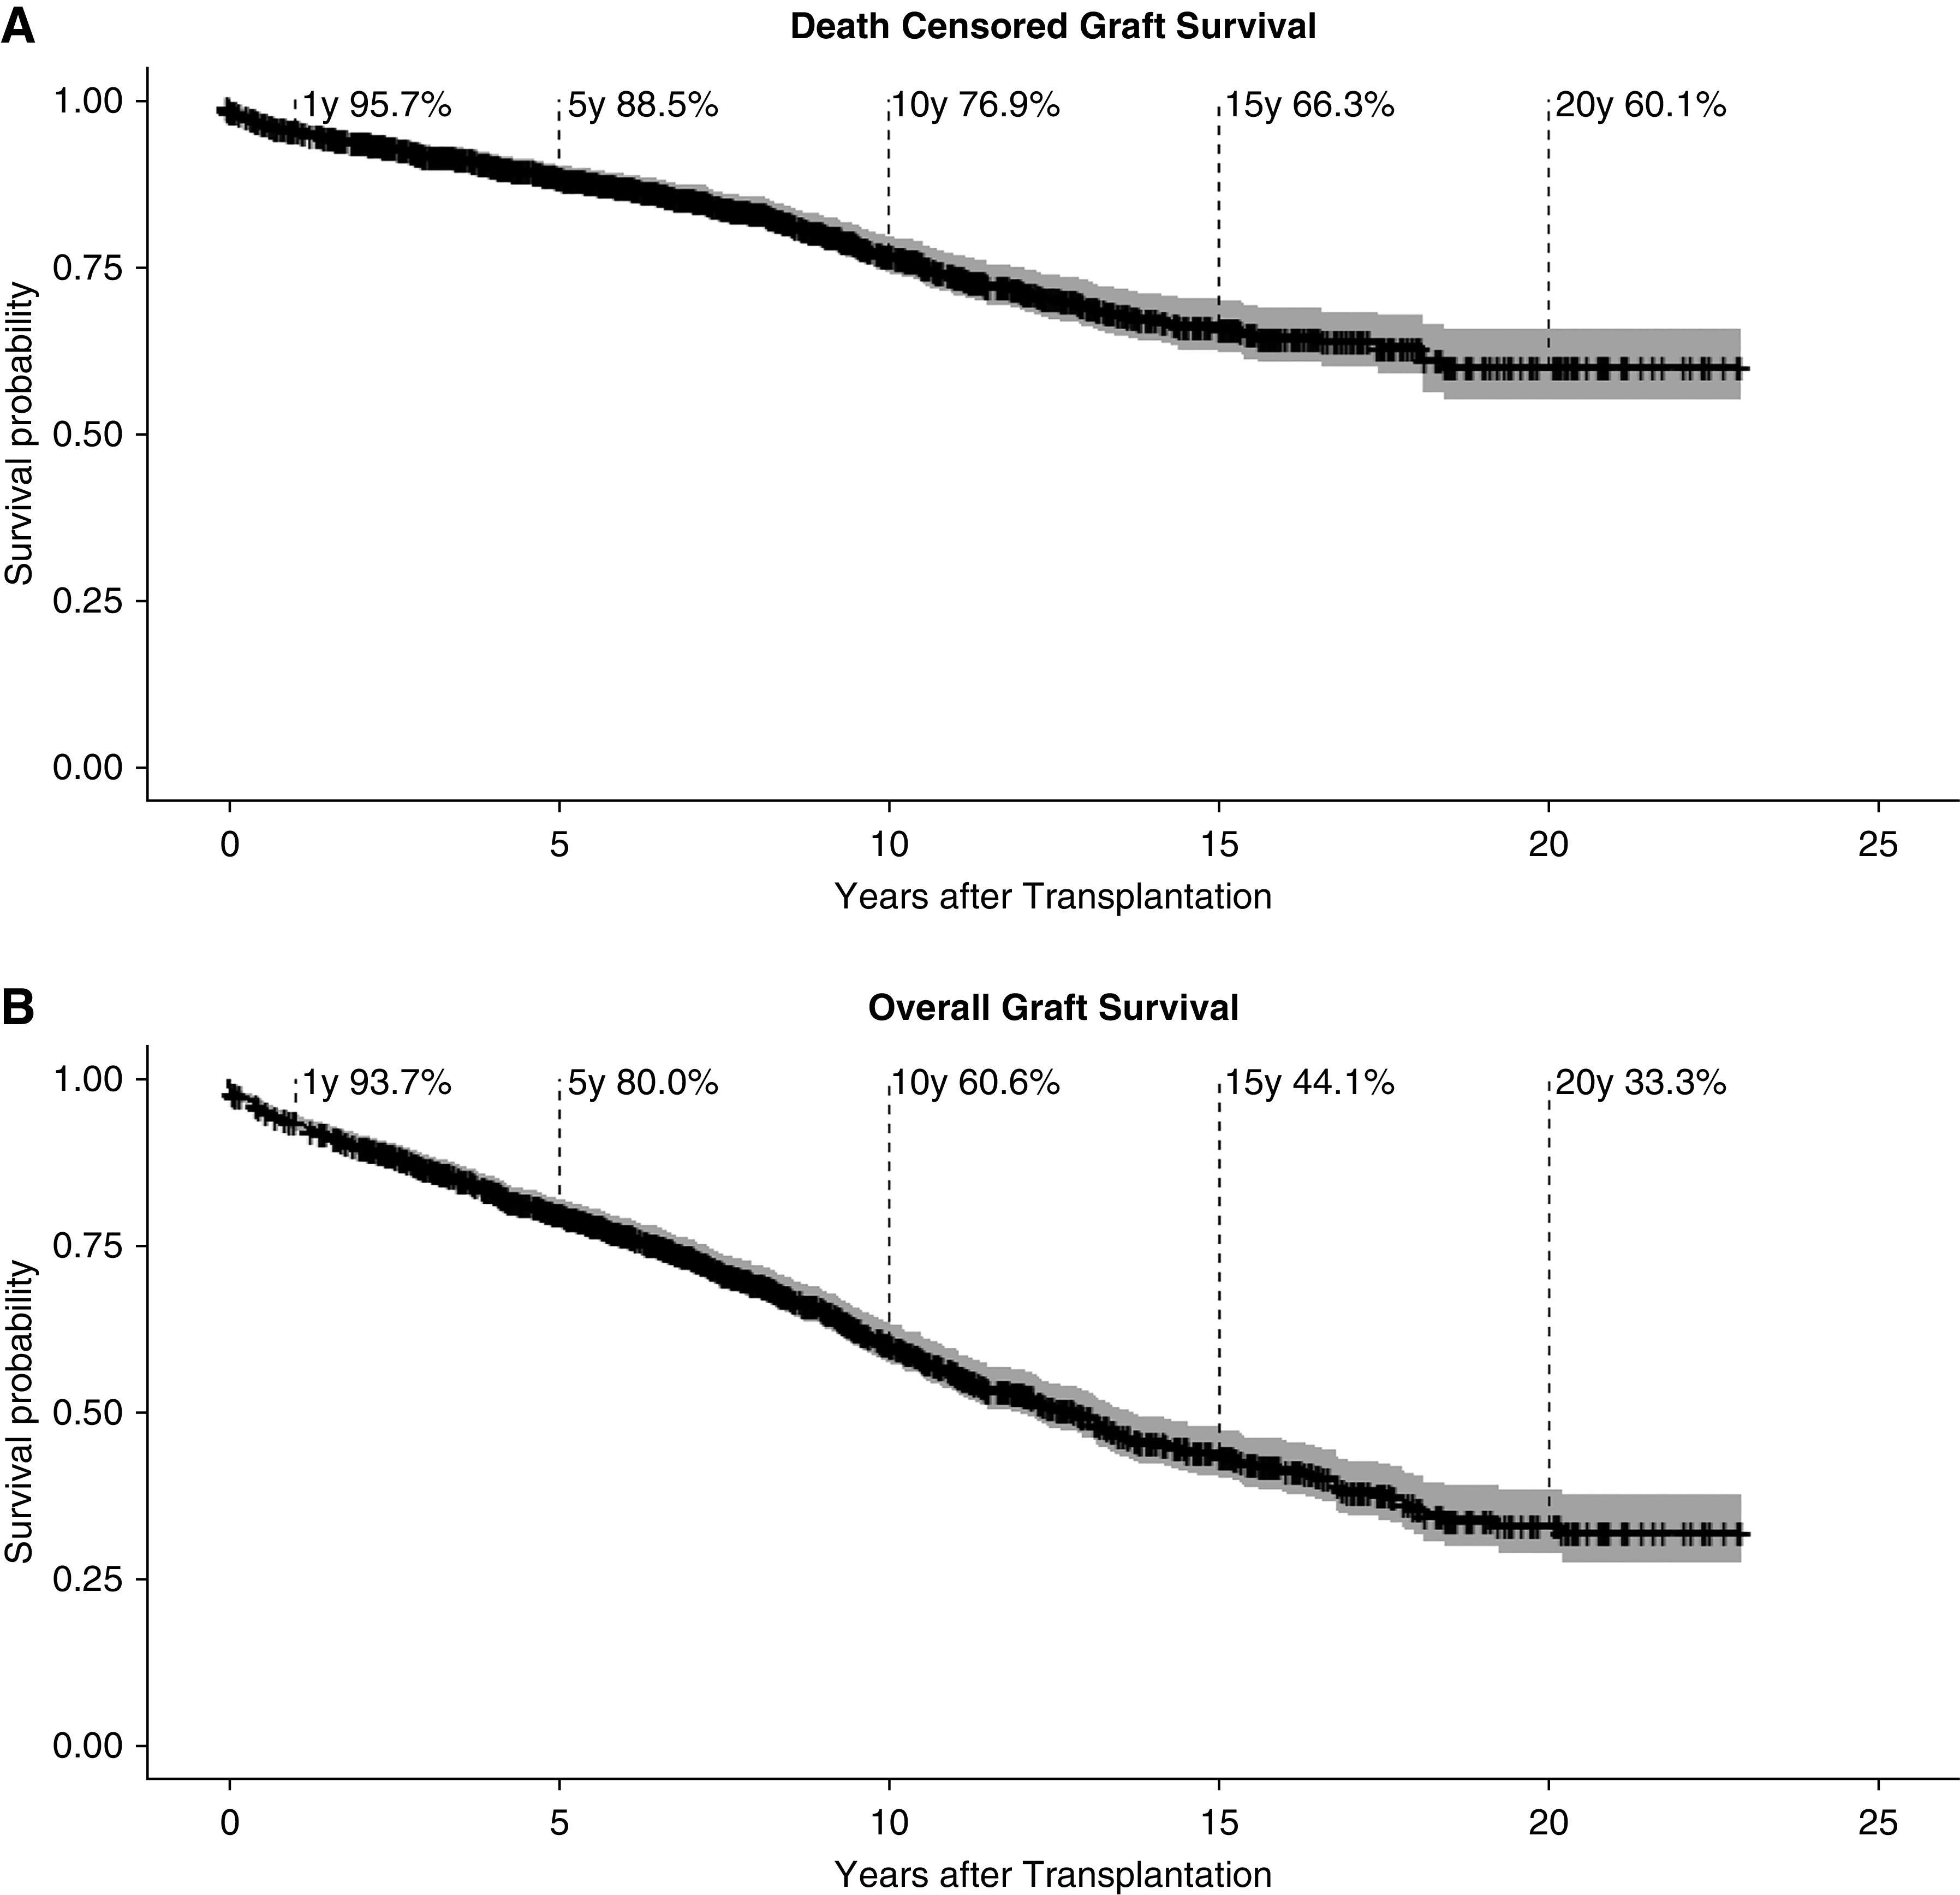
Survival curves showing Kaplan-Meier estimates for graft survival in all 1477 adult kidney transplant recipients. Confidence interval is shown in grey. (A) Death-censored graft survival (in case of death with a functioning graft the follow-up period is censored at the date of death) and (B) overall graft survival.