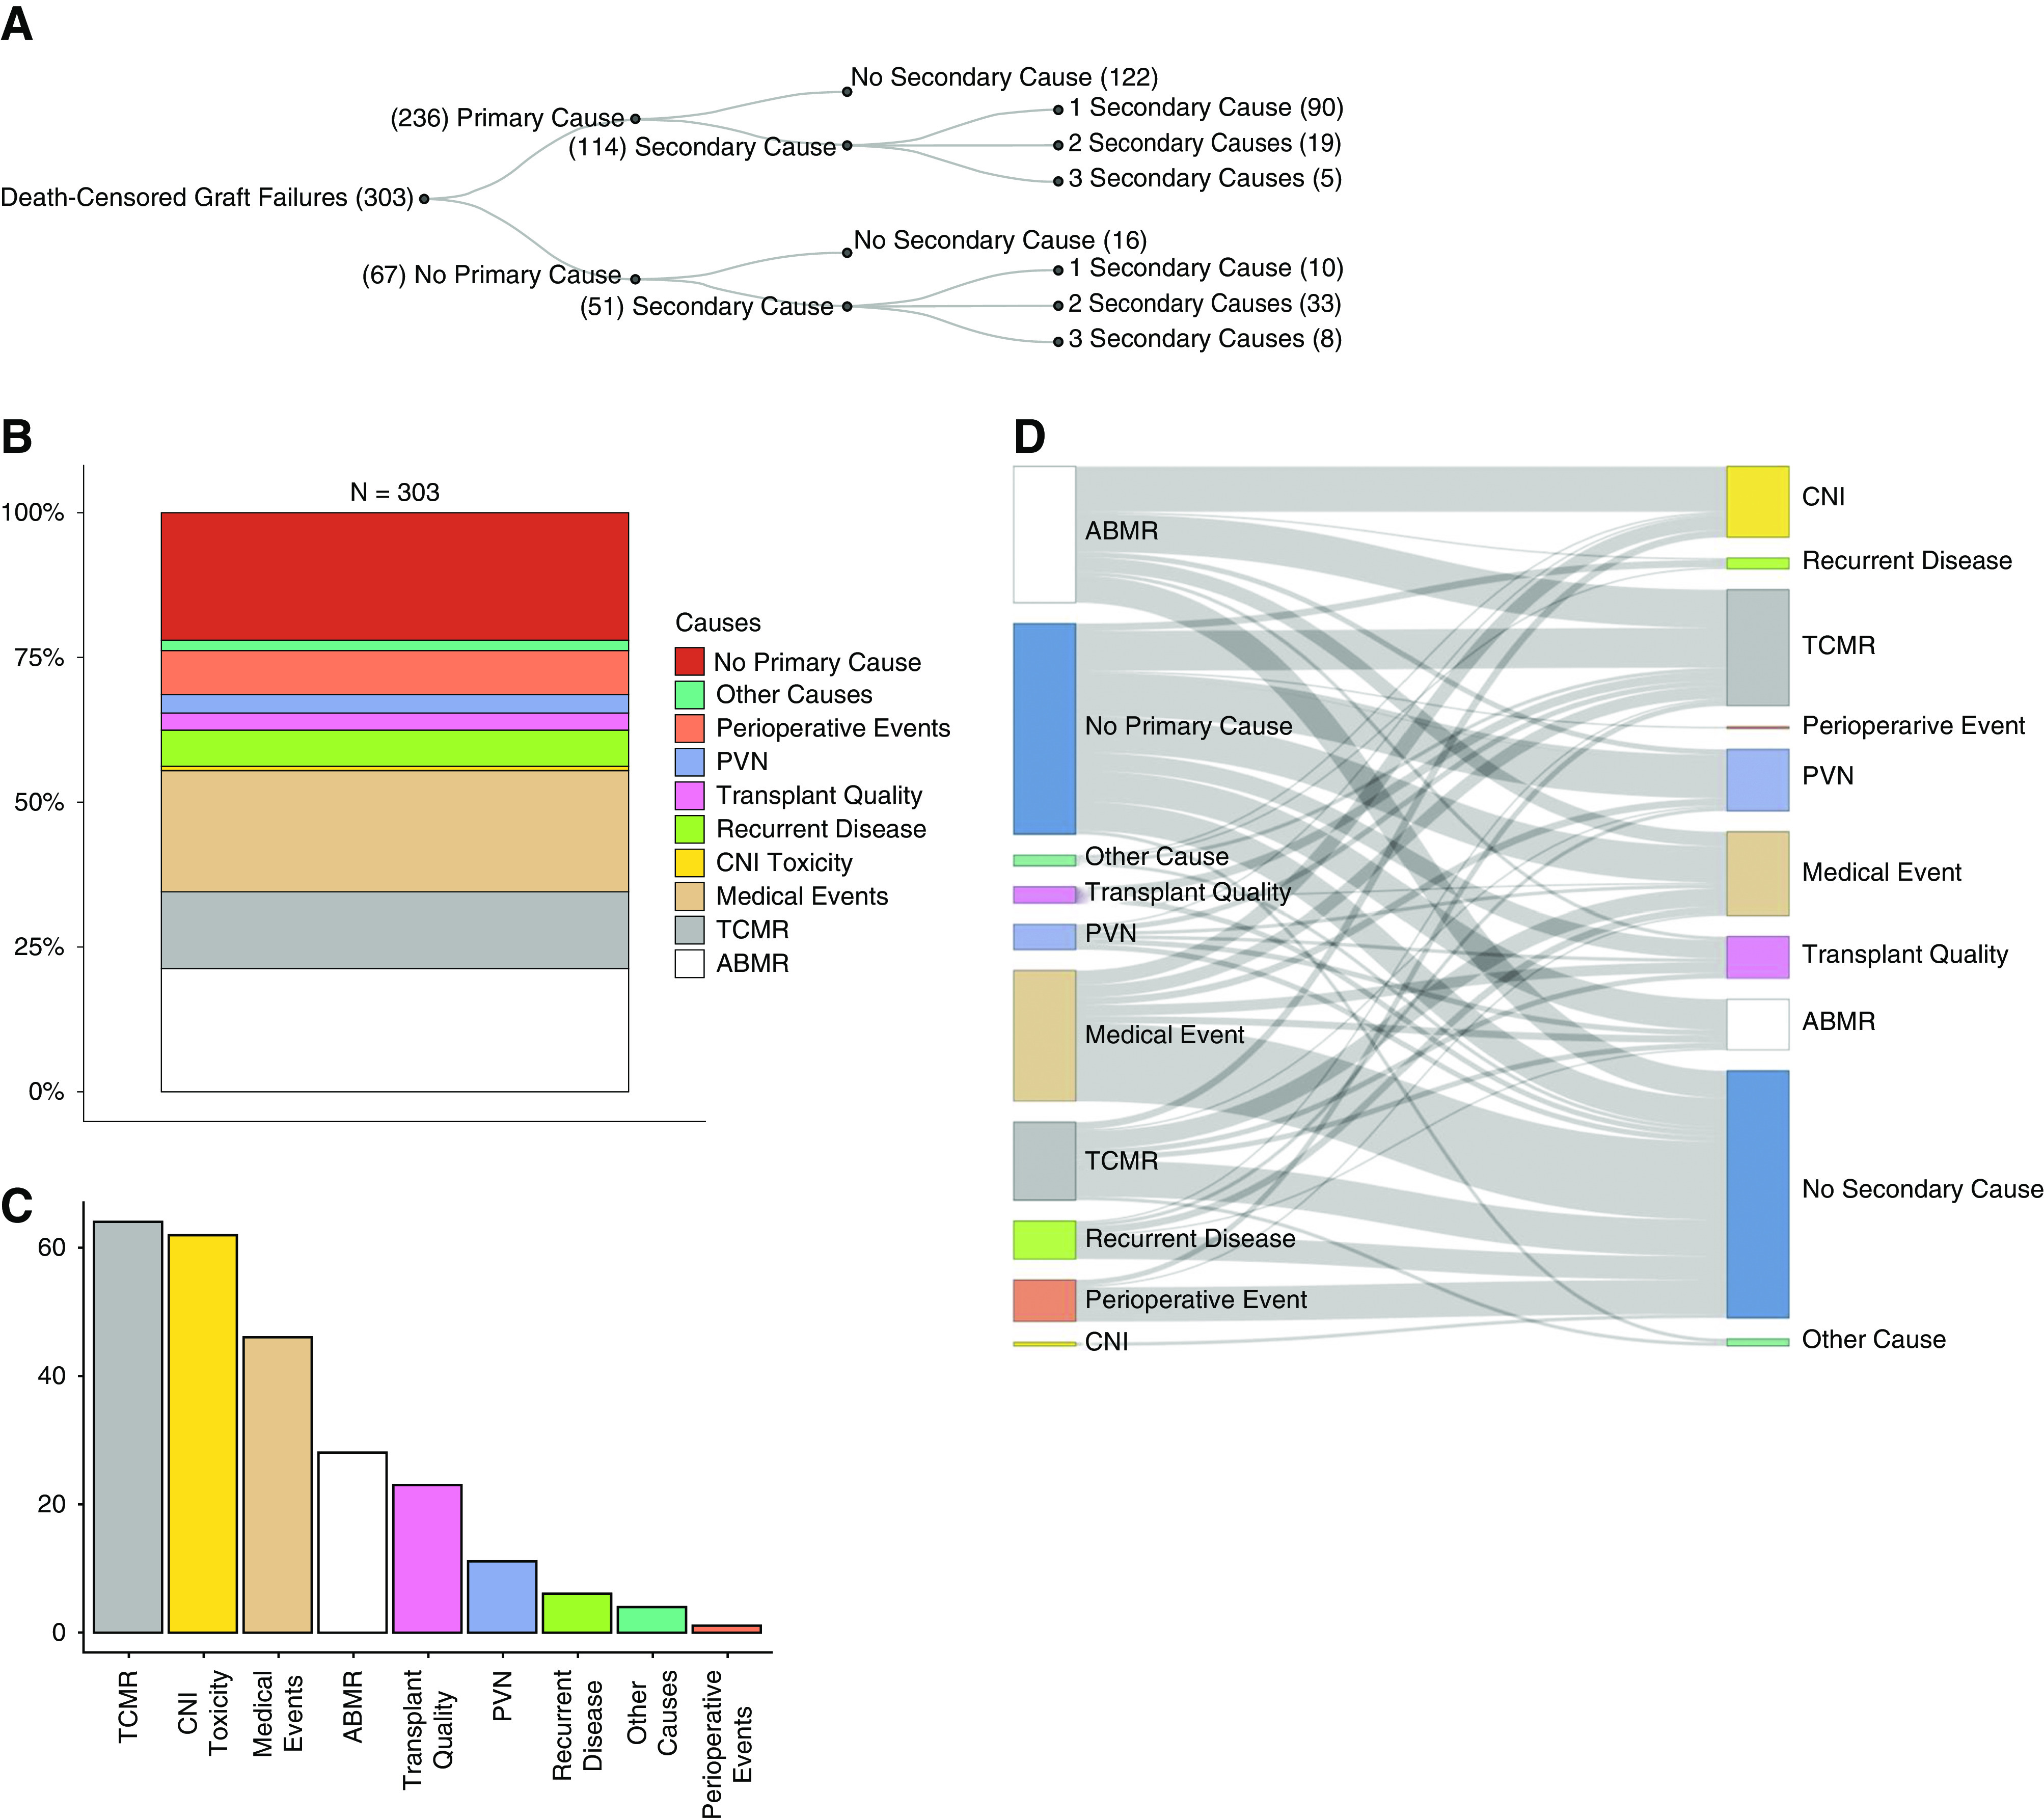
Figure 4.

Distribution and co-occurence of primary and secondary causes. (A) Overview of primary and secondary causes for graft failure. (B) Percentage of primary causes of graft failures in relation to all 303 graft failures. (C) Absolute numbers of secondary causes for graft failure. (D) Co-occurrence of primary causes (left panel) with secondary causes (right panel) per transplant failure. Bar length of primary causes (left panel) does not correlate with the corresponding absolute number because it is influenced by the number of secondary causes per transplant.
