
Figure 4.
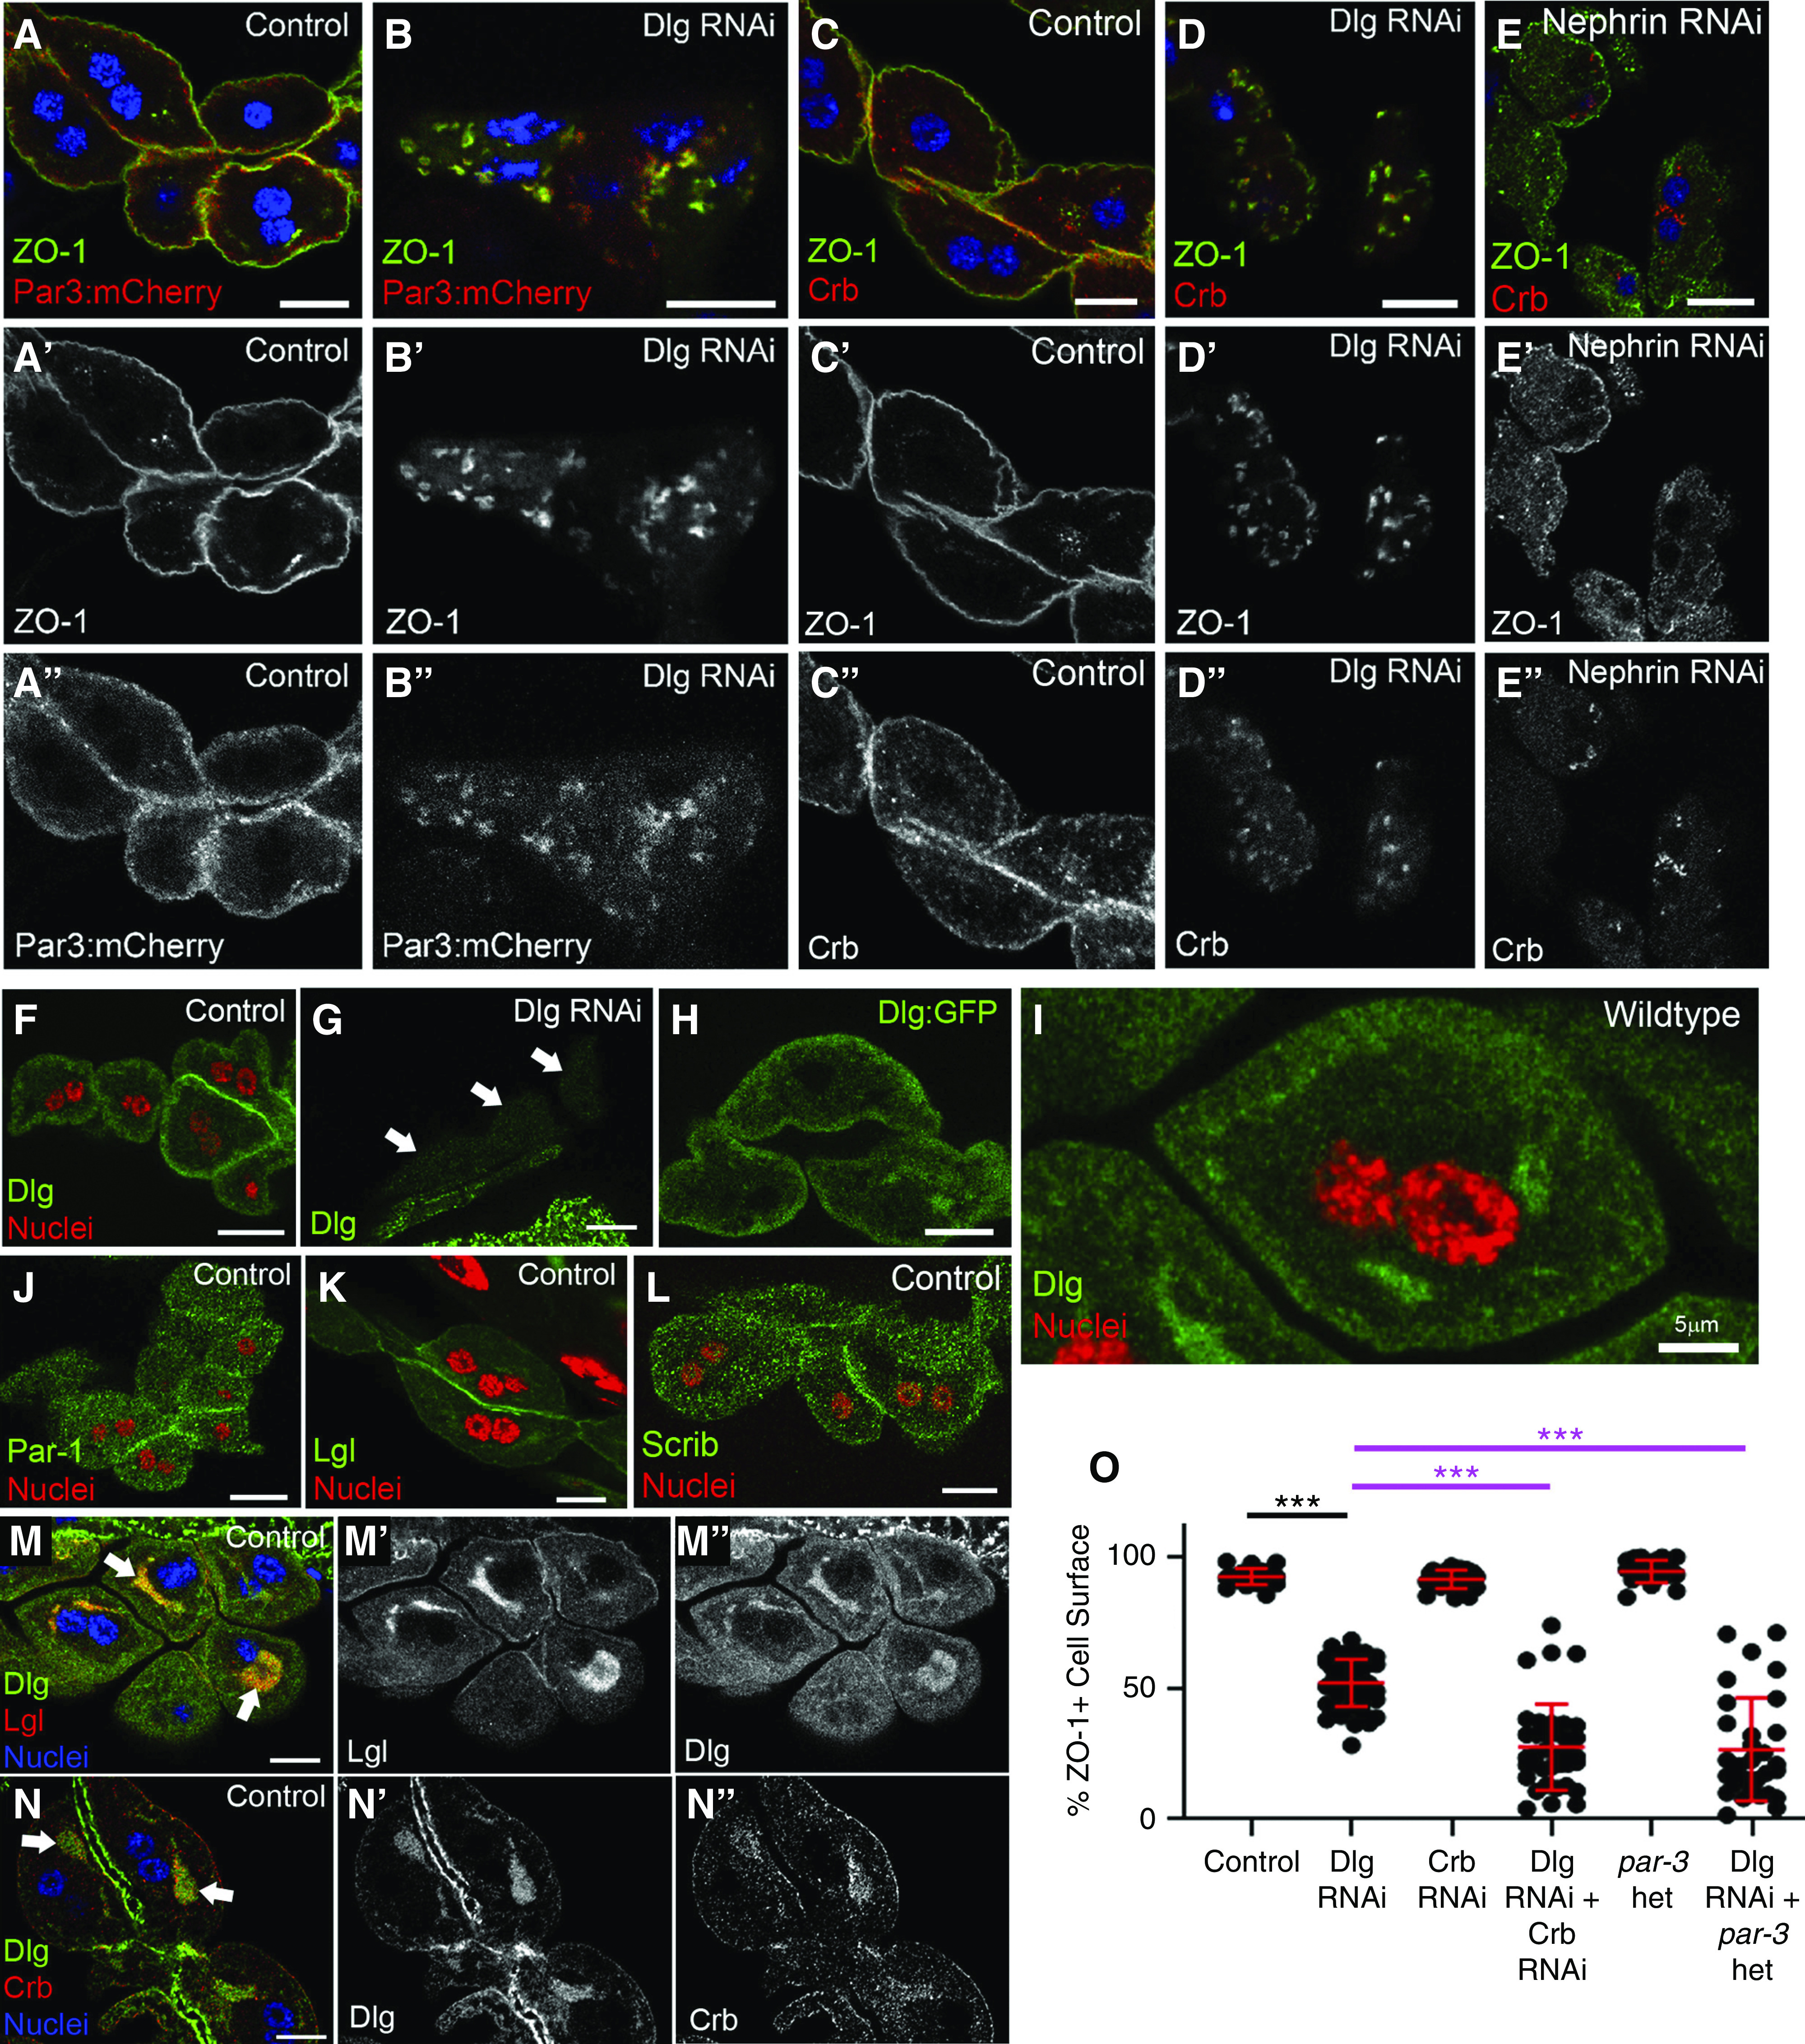
Basolateral proteins are not enriched at specific membrane domains, but cooperate with apical proteins to regulate SDs. (A-A'') In control cells, expression of Par3:mCherry (red) reveals fairly uniform cortical to subcortical localization, with some overlap with the SD protein ZO-1 (green). (B-B'') In contrast, Par3 is strongly mislocalized in Dlg-KD cells to internal aggregates that colocalize with ZO-1. (C-C'') In controls, Crb (red) shows cortical enrichment, with some internal puncta. (D-D'') In Dlg-KD cells, Crb is mislocalized to irregular cytoplasmic structures with ZO-1 (green). (E-E'') Crb and ZO-1 were also mislocalized in Nephrin-KD nephrocytes. However, note that, in Nephrin-KD cells, Crb and ZO-1 do not comislocalize, as seen in Dlg KD (D). (F) In WT nephrocytes, anti-Dlg staining (green) shows a diffuse pattern with some subcortical enrichment; a higher magnification view of Dlg localization is shown in (I). (G) Anti-Dlg staining in Dlg-KD cells shows dramatic loss of signal (white arrows point to three nephrocytes), which suggests the antibody is specific for Dlg protein, confirming that the localization pattern (F and I) is not an artifact. The brighter GFP signal below the nephrocytes is from adjacent cells of the proventriculus and muscle, where Dlg RNAi is not expressed. (H) A similar diffuse, subcortical pattern is observed for GFP-tagged Dlg. Similar localization patterns are observed for (J) Par-1 and (L) Scrib. (K) Lgl is cytoplasmic with some localization to the surface. (M-M'') In a subset of nephrocytes, Dlg and Lgl colocalized in larger internal aggregations. (N-N'') Crb also localized with Dlg at these structures. (O) Quantification of ZO-1+ perimeter in genetic-interaction studies between Dlg and apical polarity proteins. The control (Sns-Gal4×WT) and Dlg RNAi are significantly different from one another (92.6% versus 51.9%; n=23 versus n=49). Crb RNAi alone did not significantly affect ZO-1 localization (91.6%; n=25). However, KD of both Dlg and Crb dramatically reduced the amount of surface ZO-1 (27.6%; n=37). Nephrocytes heterozygous (het) for a par3 loss-of-function allele appear normal (94.6%; n=21). However, Dlg RNAi in a par3 heterozygous background dramatically enhanced the ZO-1 mislocalization phenotype (26.6%; n=31) caused by Dlg KD alone. The most relevant statistical comparisons are highlighted by bars, with magenta bars comparing the interaction groups to Dlg single KD. Error bars represent mean and standard deviation. Scale bars, 10 μm. ***P<0.001.