
Figure 5.
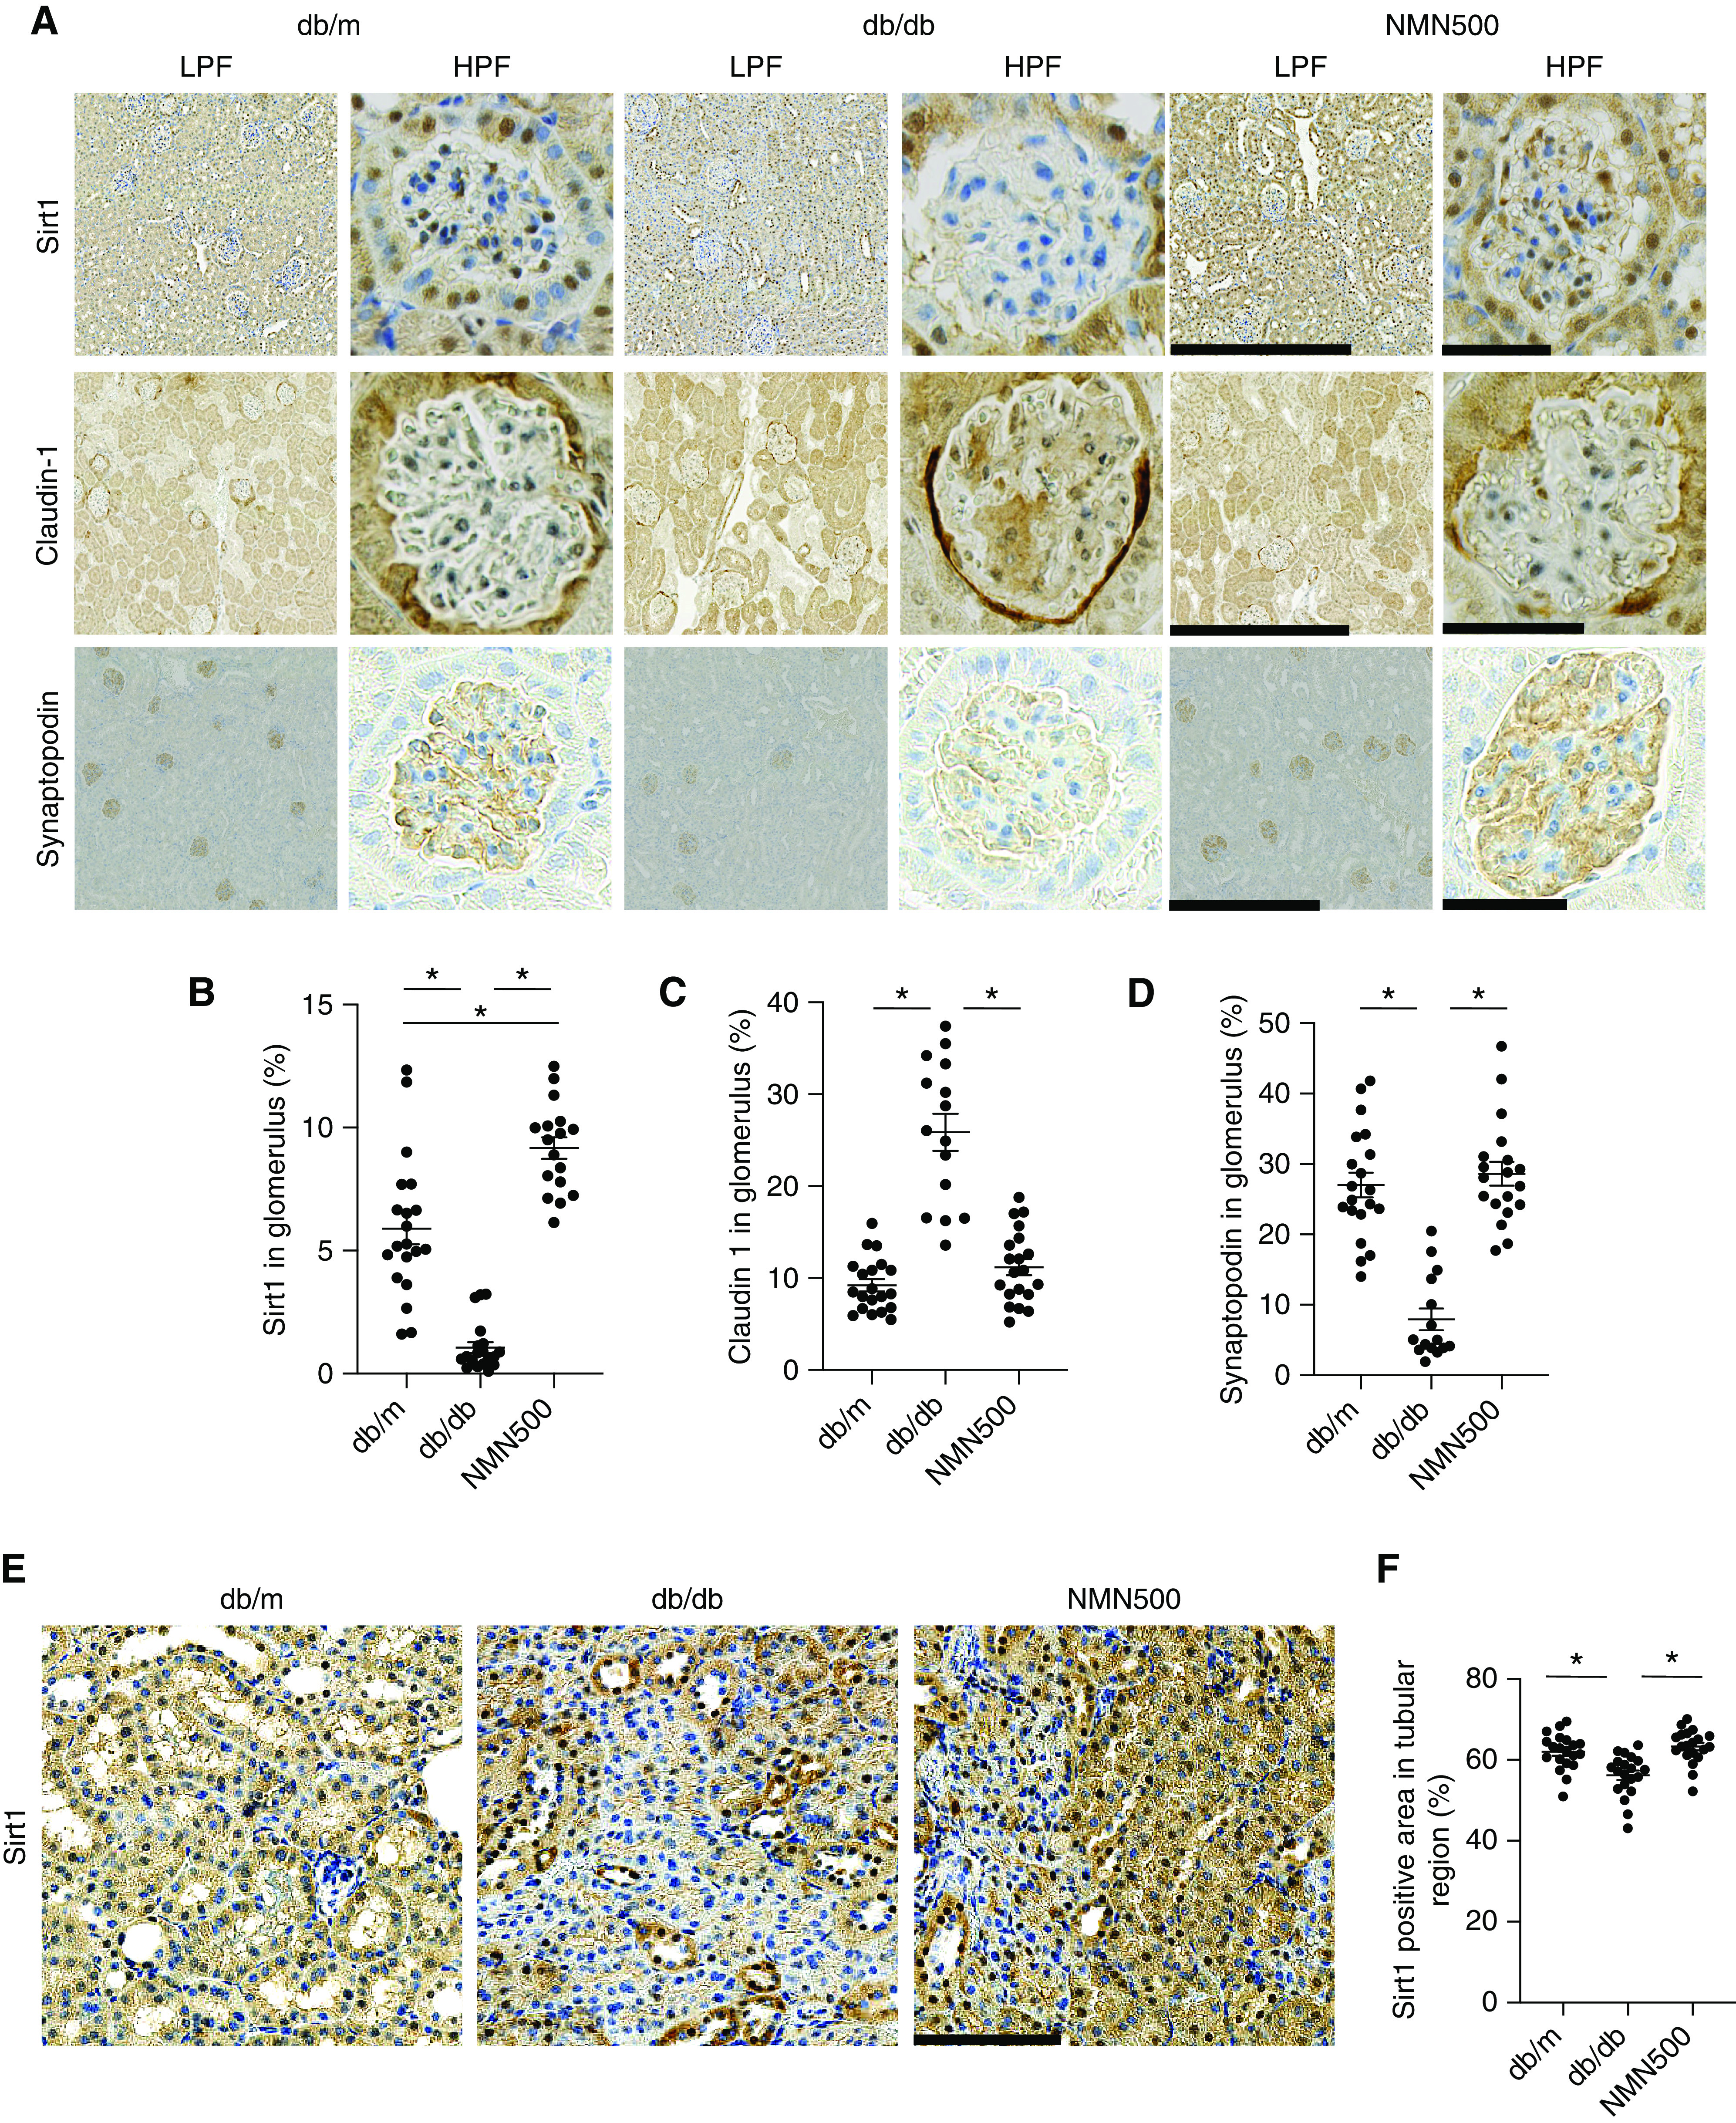
Molecular changes in glomerulus after NMN treatment (A) Representative immunostaining for Sirt1, claudin-1, and synaptopodin in the glomeruli of the db/m, db/db, and NMN500 groups. Left, low-magnification pictures (scale bar, 50 µm); right, high-magnification pictures (scale bar, 500 µm). (B) Proportional areas of Sirt1, (C) claudin-1, and (D) synaptopodin staining determined by Image-Pro Plus 7.0J software. (n=20 glomerular sections per group). (E) Representative immunostaining for Sirt1 in the tubular region of the db/m, db/db, and NMN500 groups (scale bar, 100 µm). (F) Proportional areas of Sirt1 staining determined by Image-Pro Plus 7.0J software (n=20 tubular regions per group). All data are shown as mean±SEM. Statistical significance between each group is represented by a horizontal bar. *P<0.05 by ANOVA with Tukey’s post hoc test.