
Figure 1.
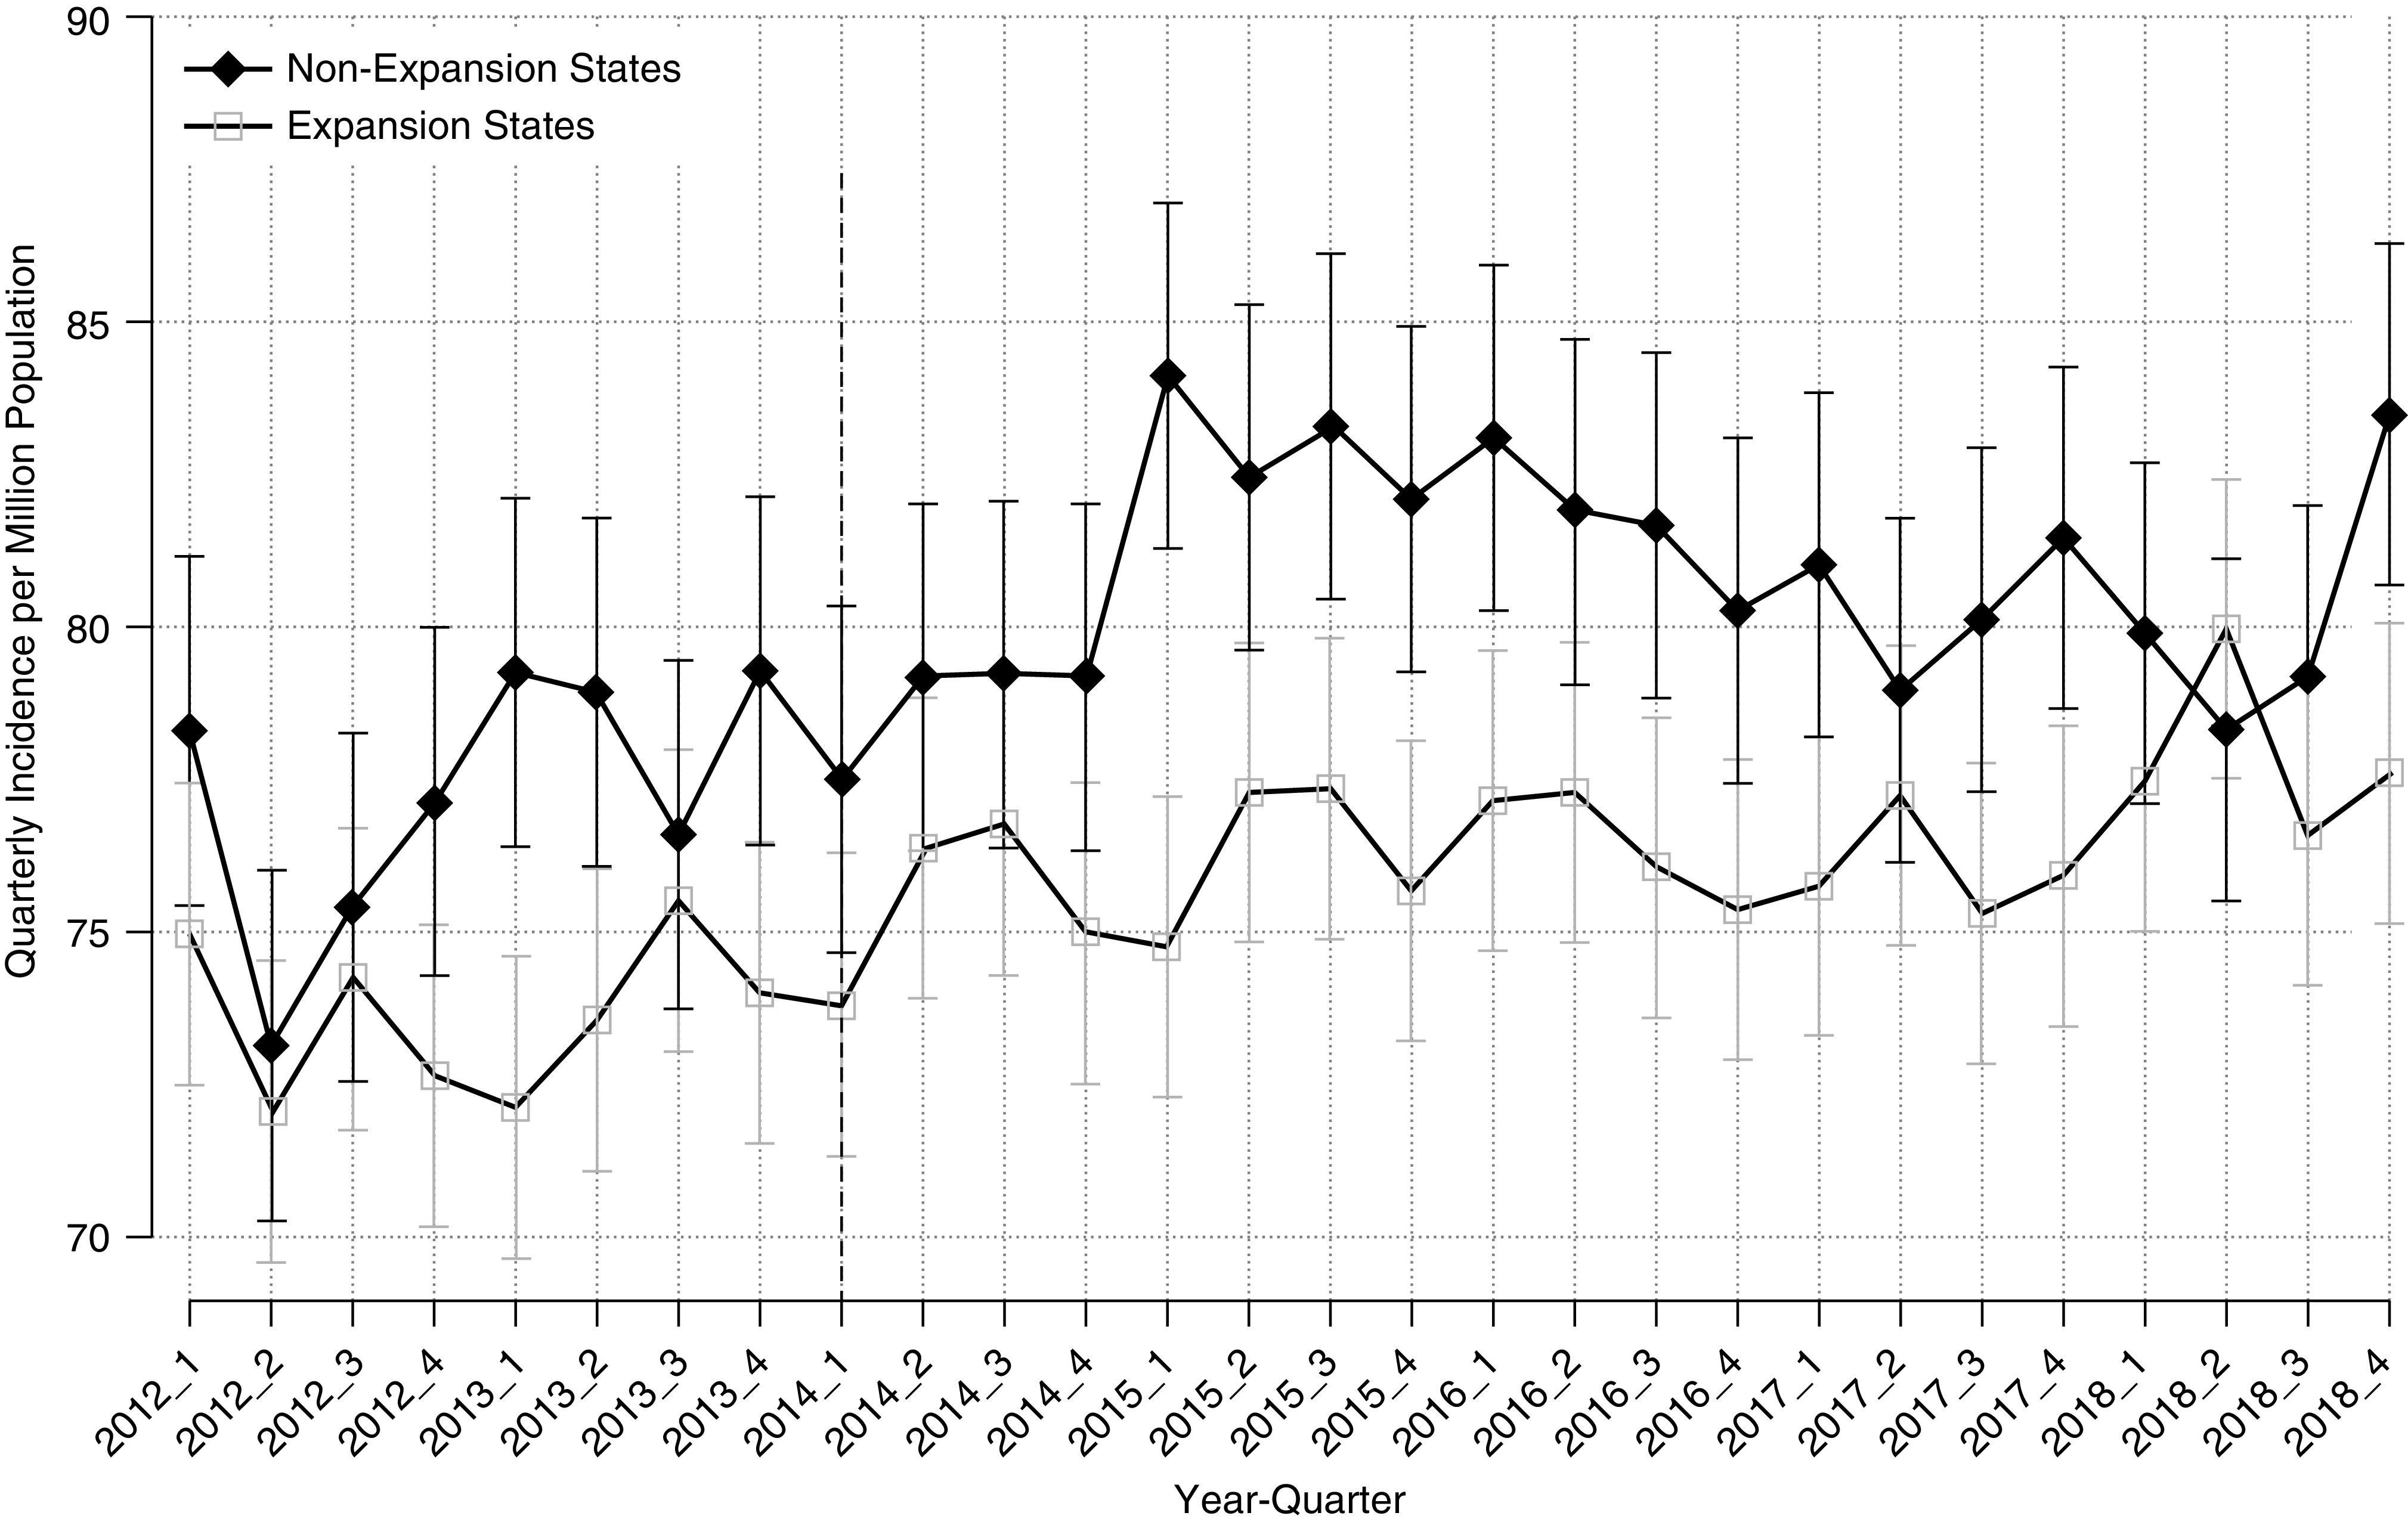
Adjusted quarterly kidney failure incidence per million population, by state Medicaid expansion status; incidence rates were similar in the pre-expansion period before diverging in 2015, one year after expansion occurred. States that expanded their Medicaid programs after January 1, 2014 (time point denoted with a vertical dashed line) are excluded (see Supplemental Table 1). Incidence rates are adjusted for age group, sex, race/ethnicity, and seasonality. Vertical bars provide 95% confidence intervals.