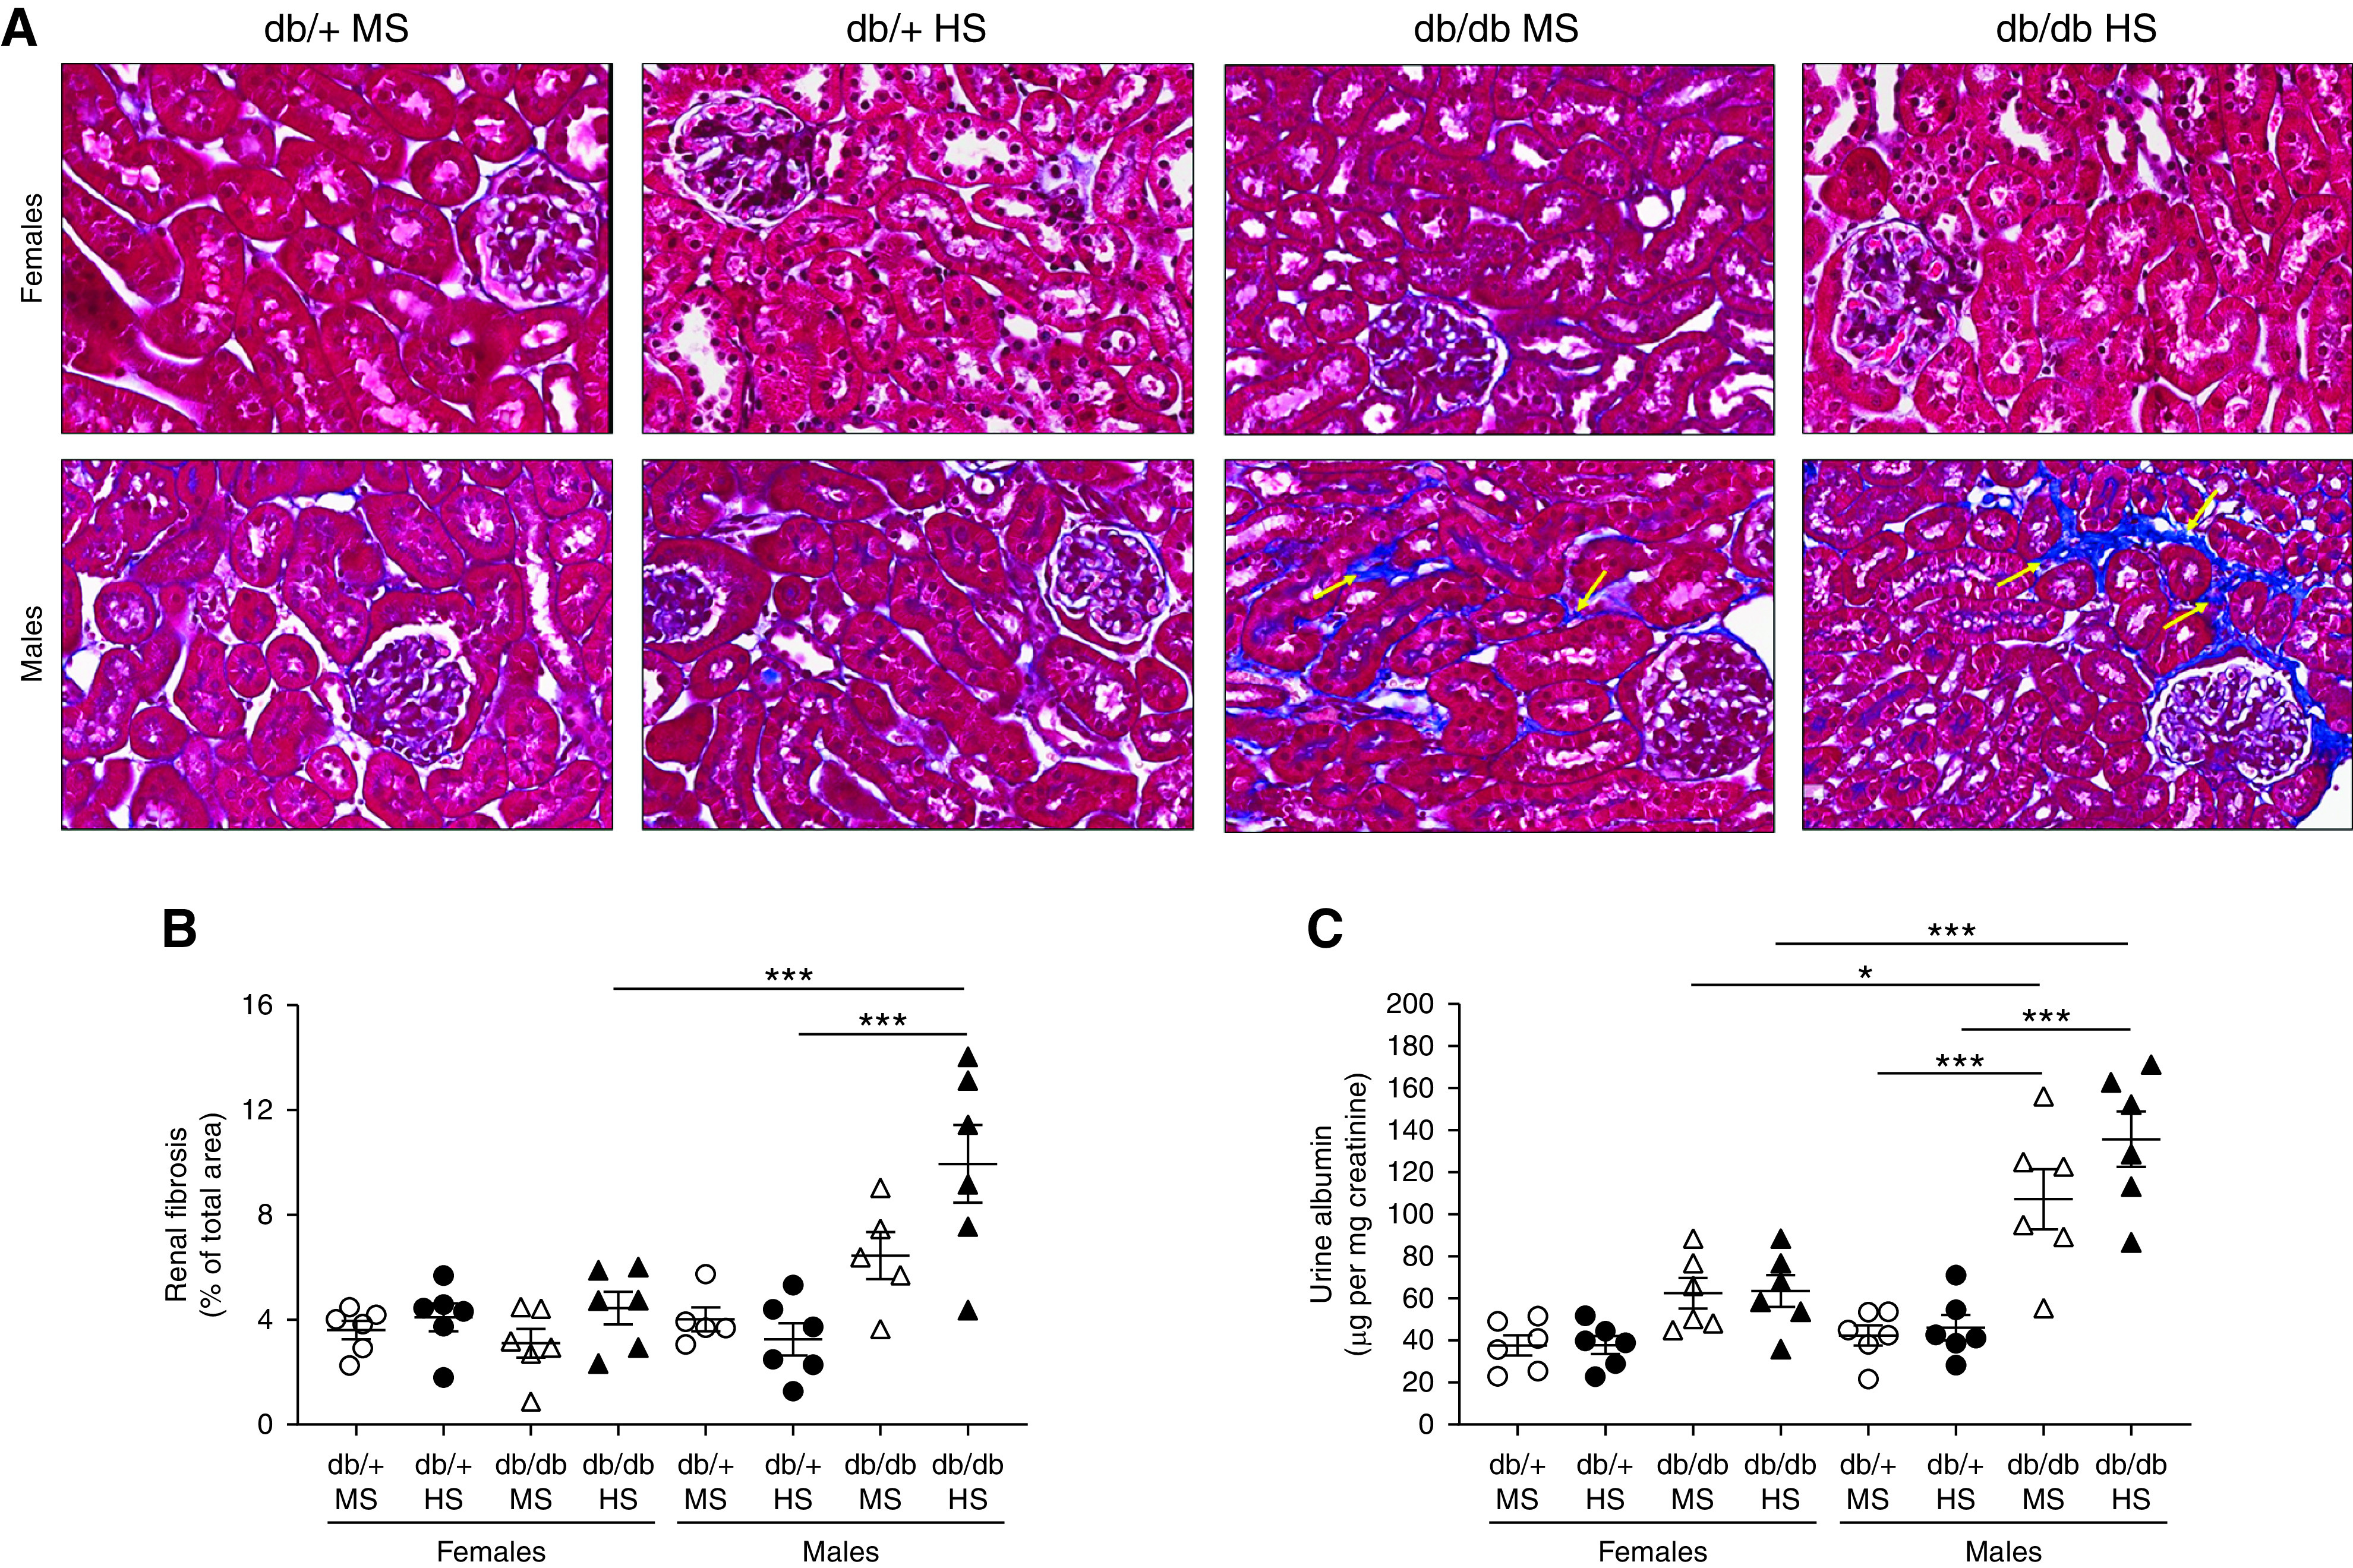
Figure 3.

Male db/db mice display higher fibrosis and albuminuria than female and male db/+ mice. (A) Renal interstitial fibrosis was evaluated using Masson trichrome staining and (B) expressed as the percentage of fibrosis of the total kidney area. (C) Urinary albumin was measured by ELISA in 24-hour urine and expressed as micrograms of albumin per milligram of creatinine. Data are expressed as dot plots. Horizontal bars represent the mean±SD (n=6 per group). *P<0.05, ***P<0.001 by three-way ANOVA. Yellow arrows in (A) indicate interstitial fibrosis.
