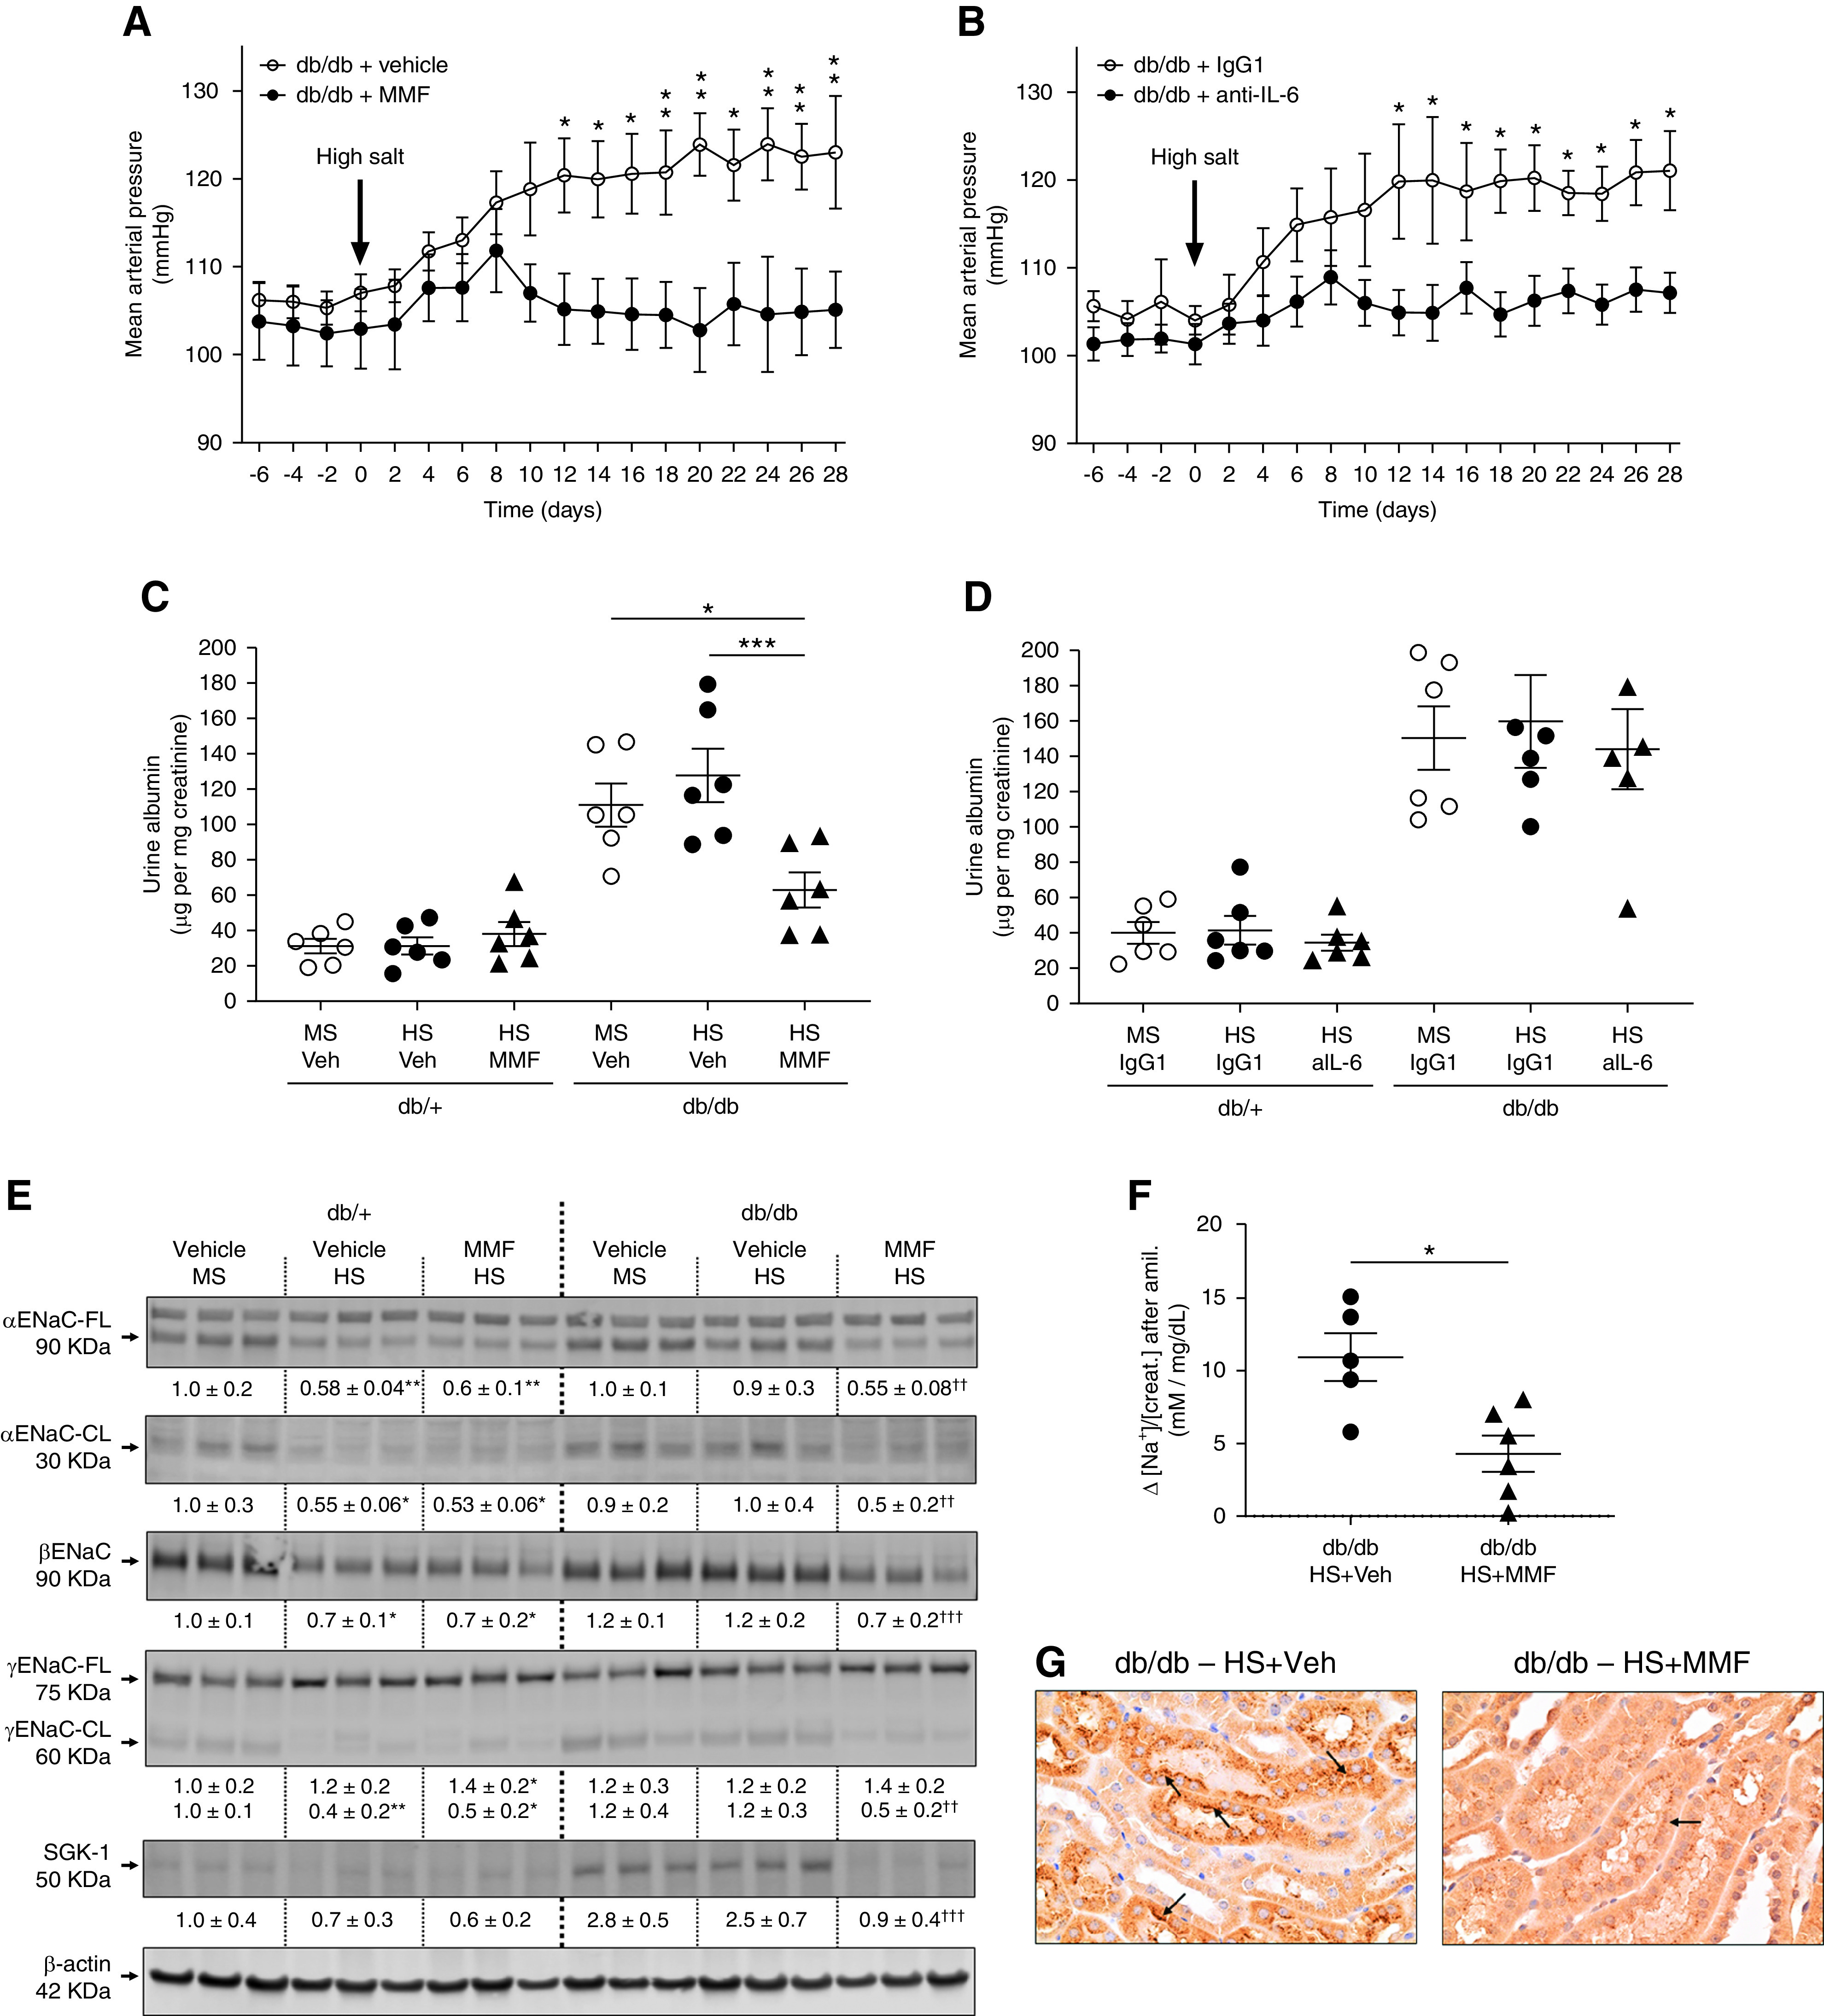
Figure 5.

MMF and IL-6 neutralization prevent salt sensitivity in male db/db mice. (A) Male db/db mice were exposed to the HS diet for 4 weeks in the presence of MMF (30 mg/kg per day dissolved in 3% DMSO vol/vol in saline). Control mice were treated with vehicle (Veh; DMSO 3% in saline). (B) Another cohort of male db/db mice was exposed to the HS diet in the presence of anti–IL-6 neutralizing antibody (aIL-6; 0.2 mg/wk dissolved in saline). Control mice received isotype control rat IgG1 (0.2 mg/wk dissolved in saline). MAP was continuously monitored by radiotelemetry. Data are expressed as daily average. *P<0.05, **P<0.01 versus db/db mice receiving control treatment by multiple t test. At the end of the experiment (week 34), mice were housed in metabolic cages for 24 hours for urine collection. (C–D) Urine albumin was assessed by ELISA and expressed as micrograms of albumin per milligram of creatinine. (E) For mice treated with MMF, immunoblots for full-length (FL) and cleaved (CL) αENaC, βENaC, γENaC-FL and -CL, and SGK-1 were performed in kidney homogenates with a constant amount of protein per lane; β-actin was used as loading control. Relative abundance from each group is displayed below the corresponding blot. The group of db/+ mice on MS and vehicle was considered as 1.0. Blots from three representative samples are shown. Uncropped immunoblots and dot-plot analysis for all samples are shown in Supplemental Figures 14–17. *P<0.05, **P<0.01 versus db/+ mice on MS and vehicle; †† P<0.01, ††† P<0.001 versus db/db mice on HS and vehicle by two-way ANOVA. (F) For the amiloride test, the difference (Δ) in urine sodium/creatinine concentration ([Na+]/[creat.]) between vehicle (0.9% saline) and amiloride injection (5 mg/g body wt in 100 ml of 0.9% NaCl) was calculated. Urine was collected for 4 hours. Data are expressed as dot plots. Horizontal bars represent the mean±SD (n=6 per group). *P<0.05 by t test. (G) Immunohistochemical analysis of αENaC in kidney samples. Black arrows indicate positive αENaC staining.
