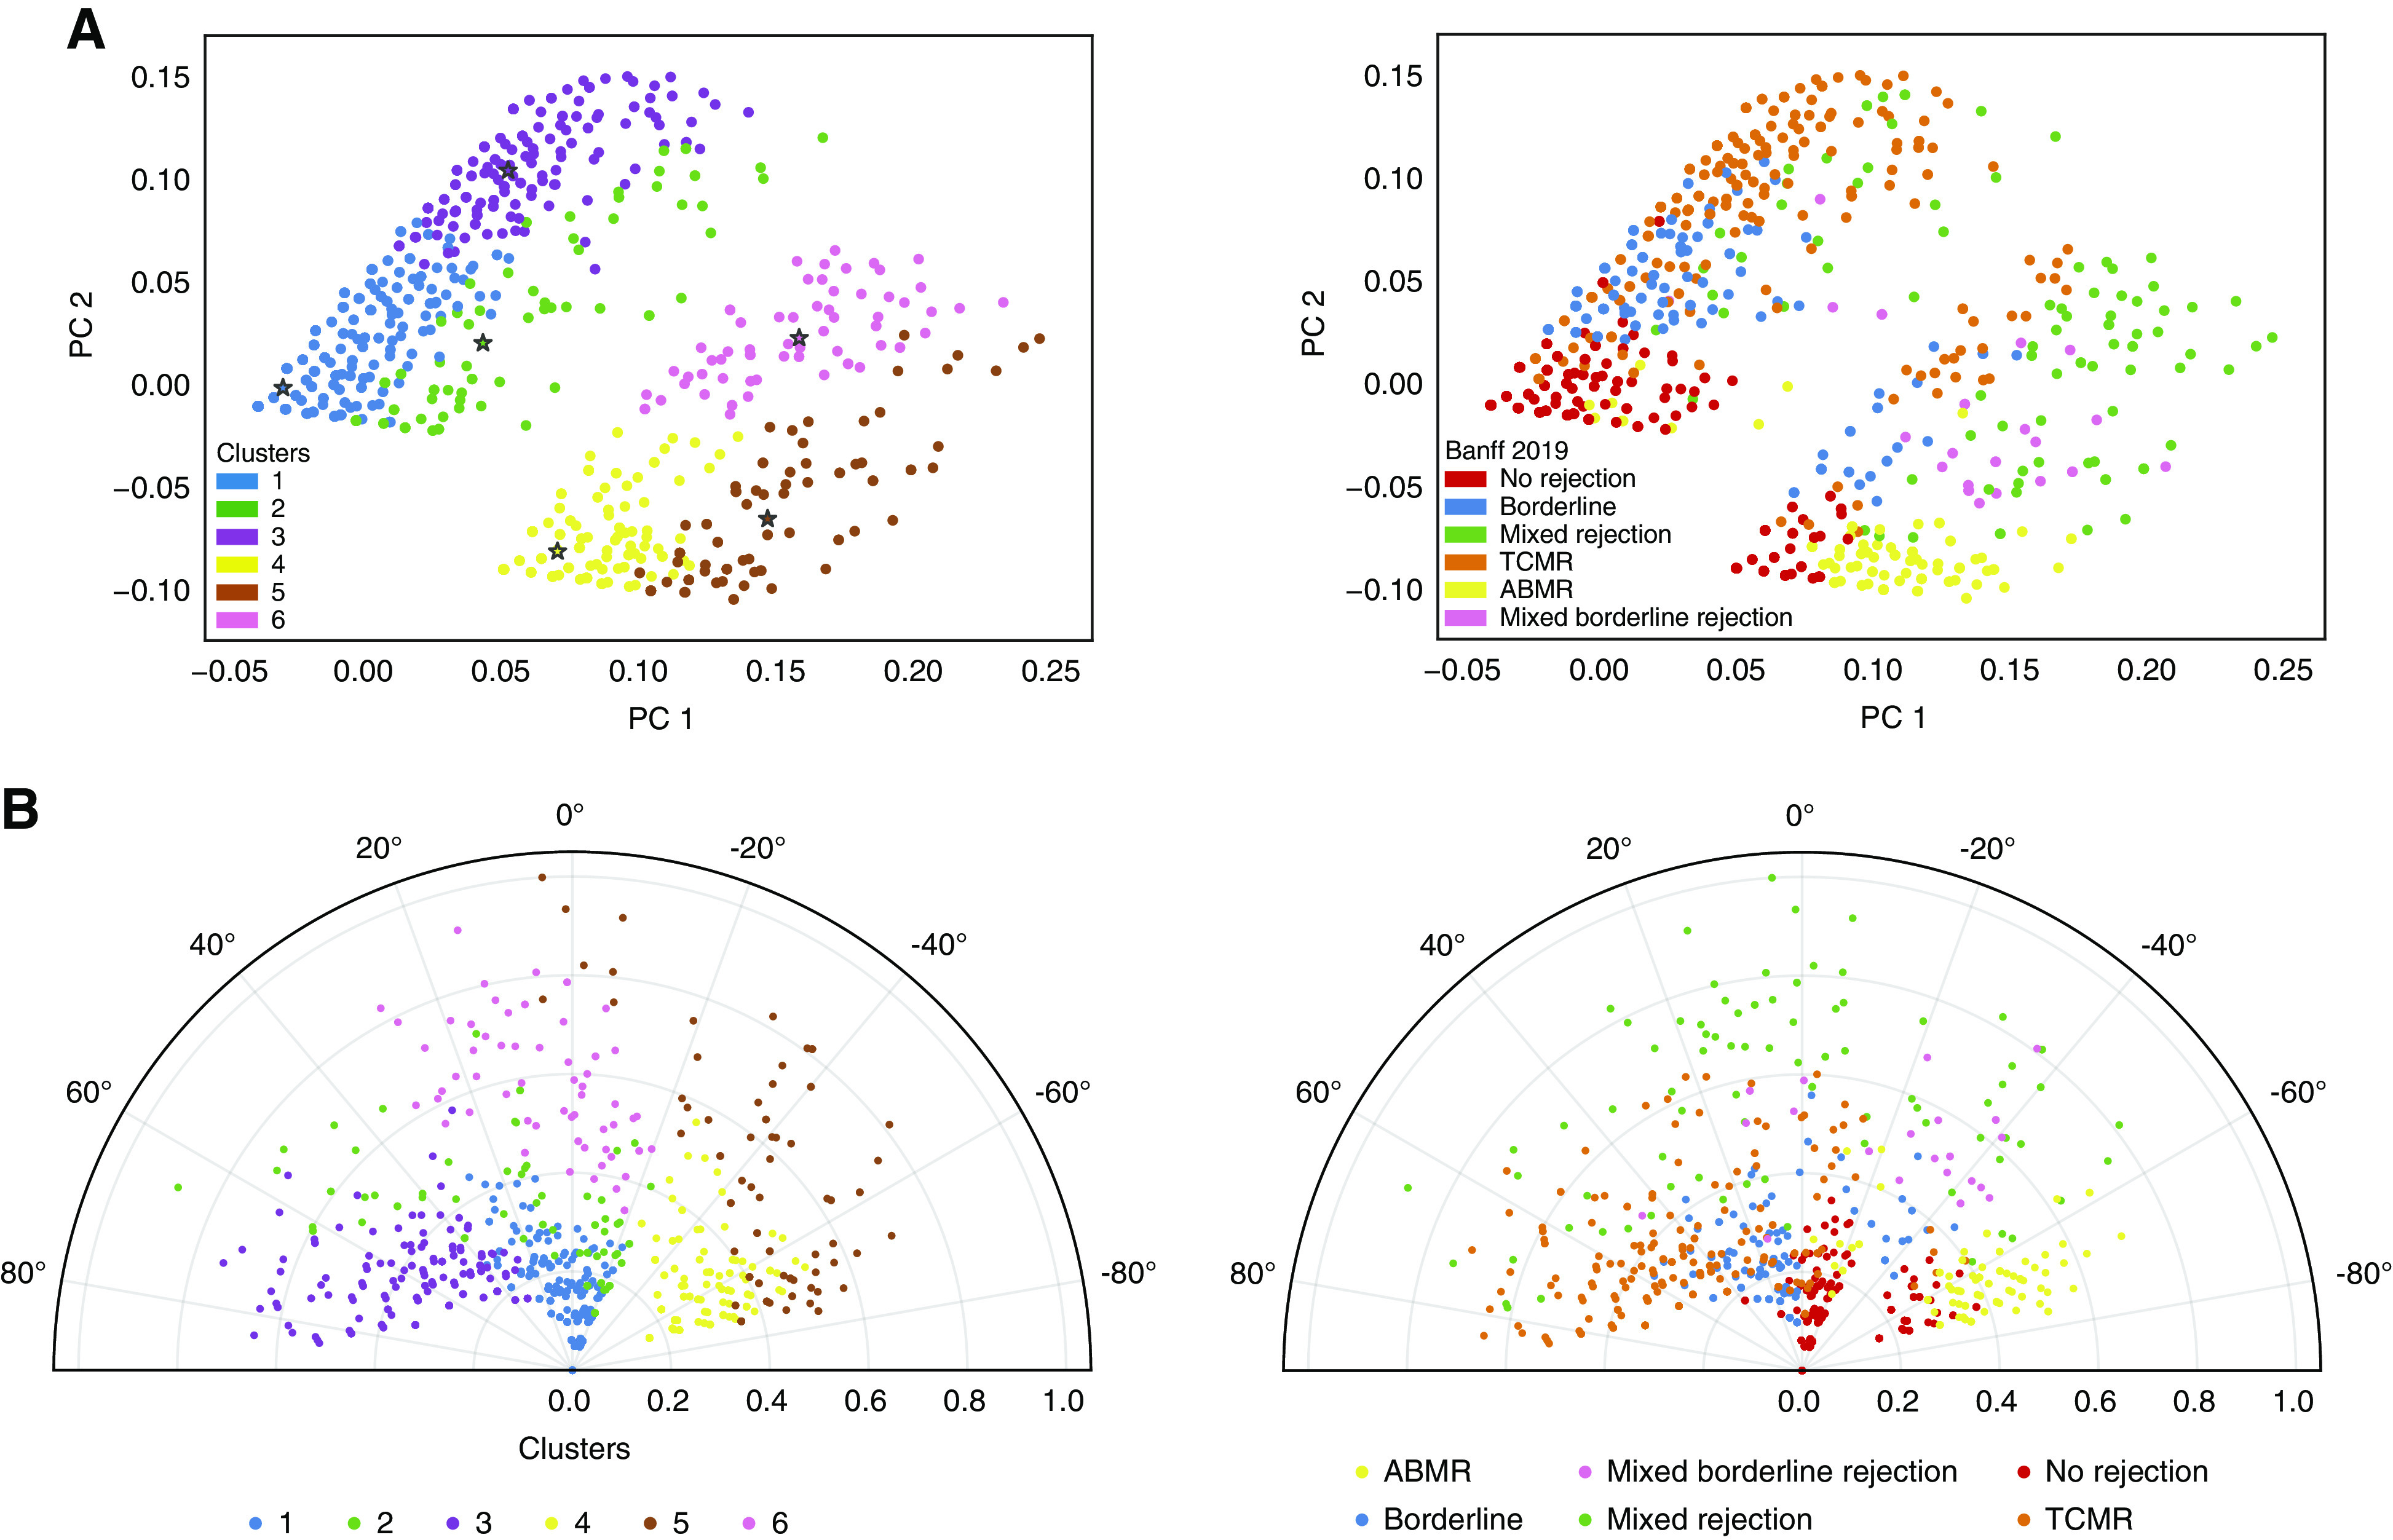
Figure 2.

Visualization of the Banff classification and the six clusters on the whole set of kidney transplant biopsies. (A) PCA of the 3510 derivation cohort biopsies calculated from the acute lesion scores and DSA status, overlaid with the six clusters obtained from the semisupervised reclassification pipeline (left panel) and according to the Banff 2019 classification (right panel). Due to the distance-based approach of k-mean, the clusters obtained have a visually better separation than the Banff classification on two-dimensional plots. (B) Polar plot of the 3510 biopsies, with the radius representing the sum of re-weighted acute lesions scores, scaled to the unit interval (from 0 to 1), and the theta angle being directly related to the phenotype using the second semisupervised principal component, namely, the second component of PCA after weighting the lesions scores, overlaid with the six clusters obtained from the semisupervised reclassification pipeline (left panel) and according to the Banff 2019 classification (right panel).
