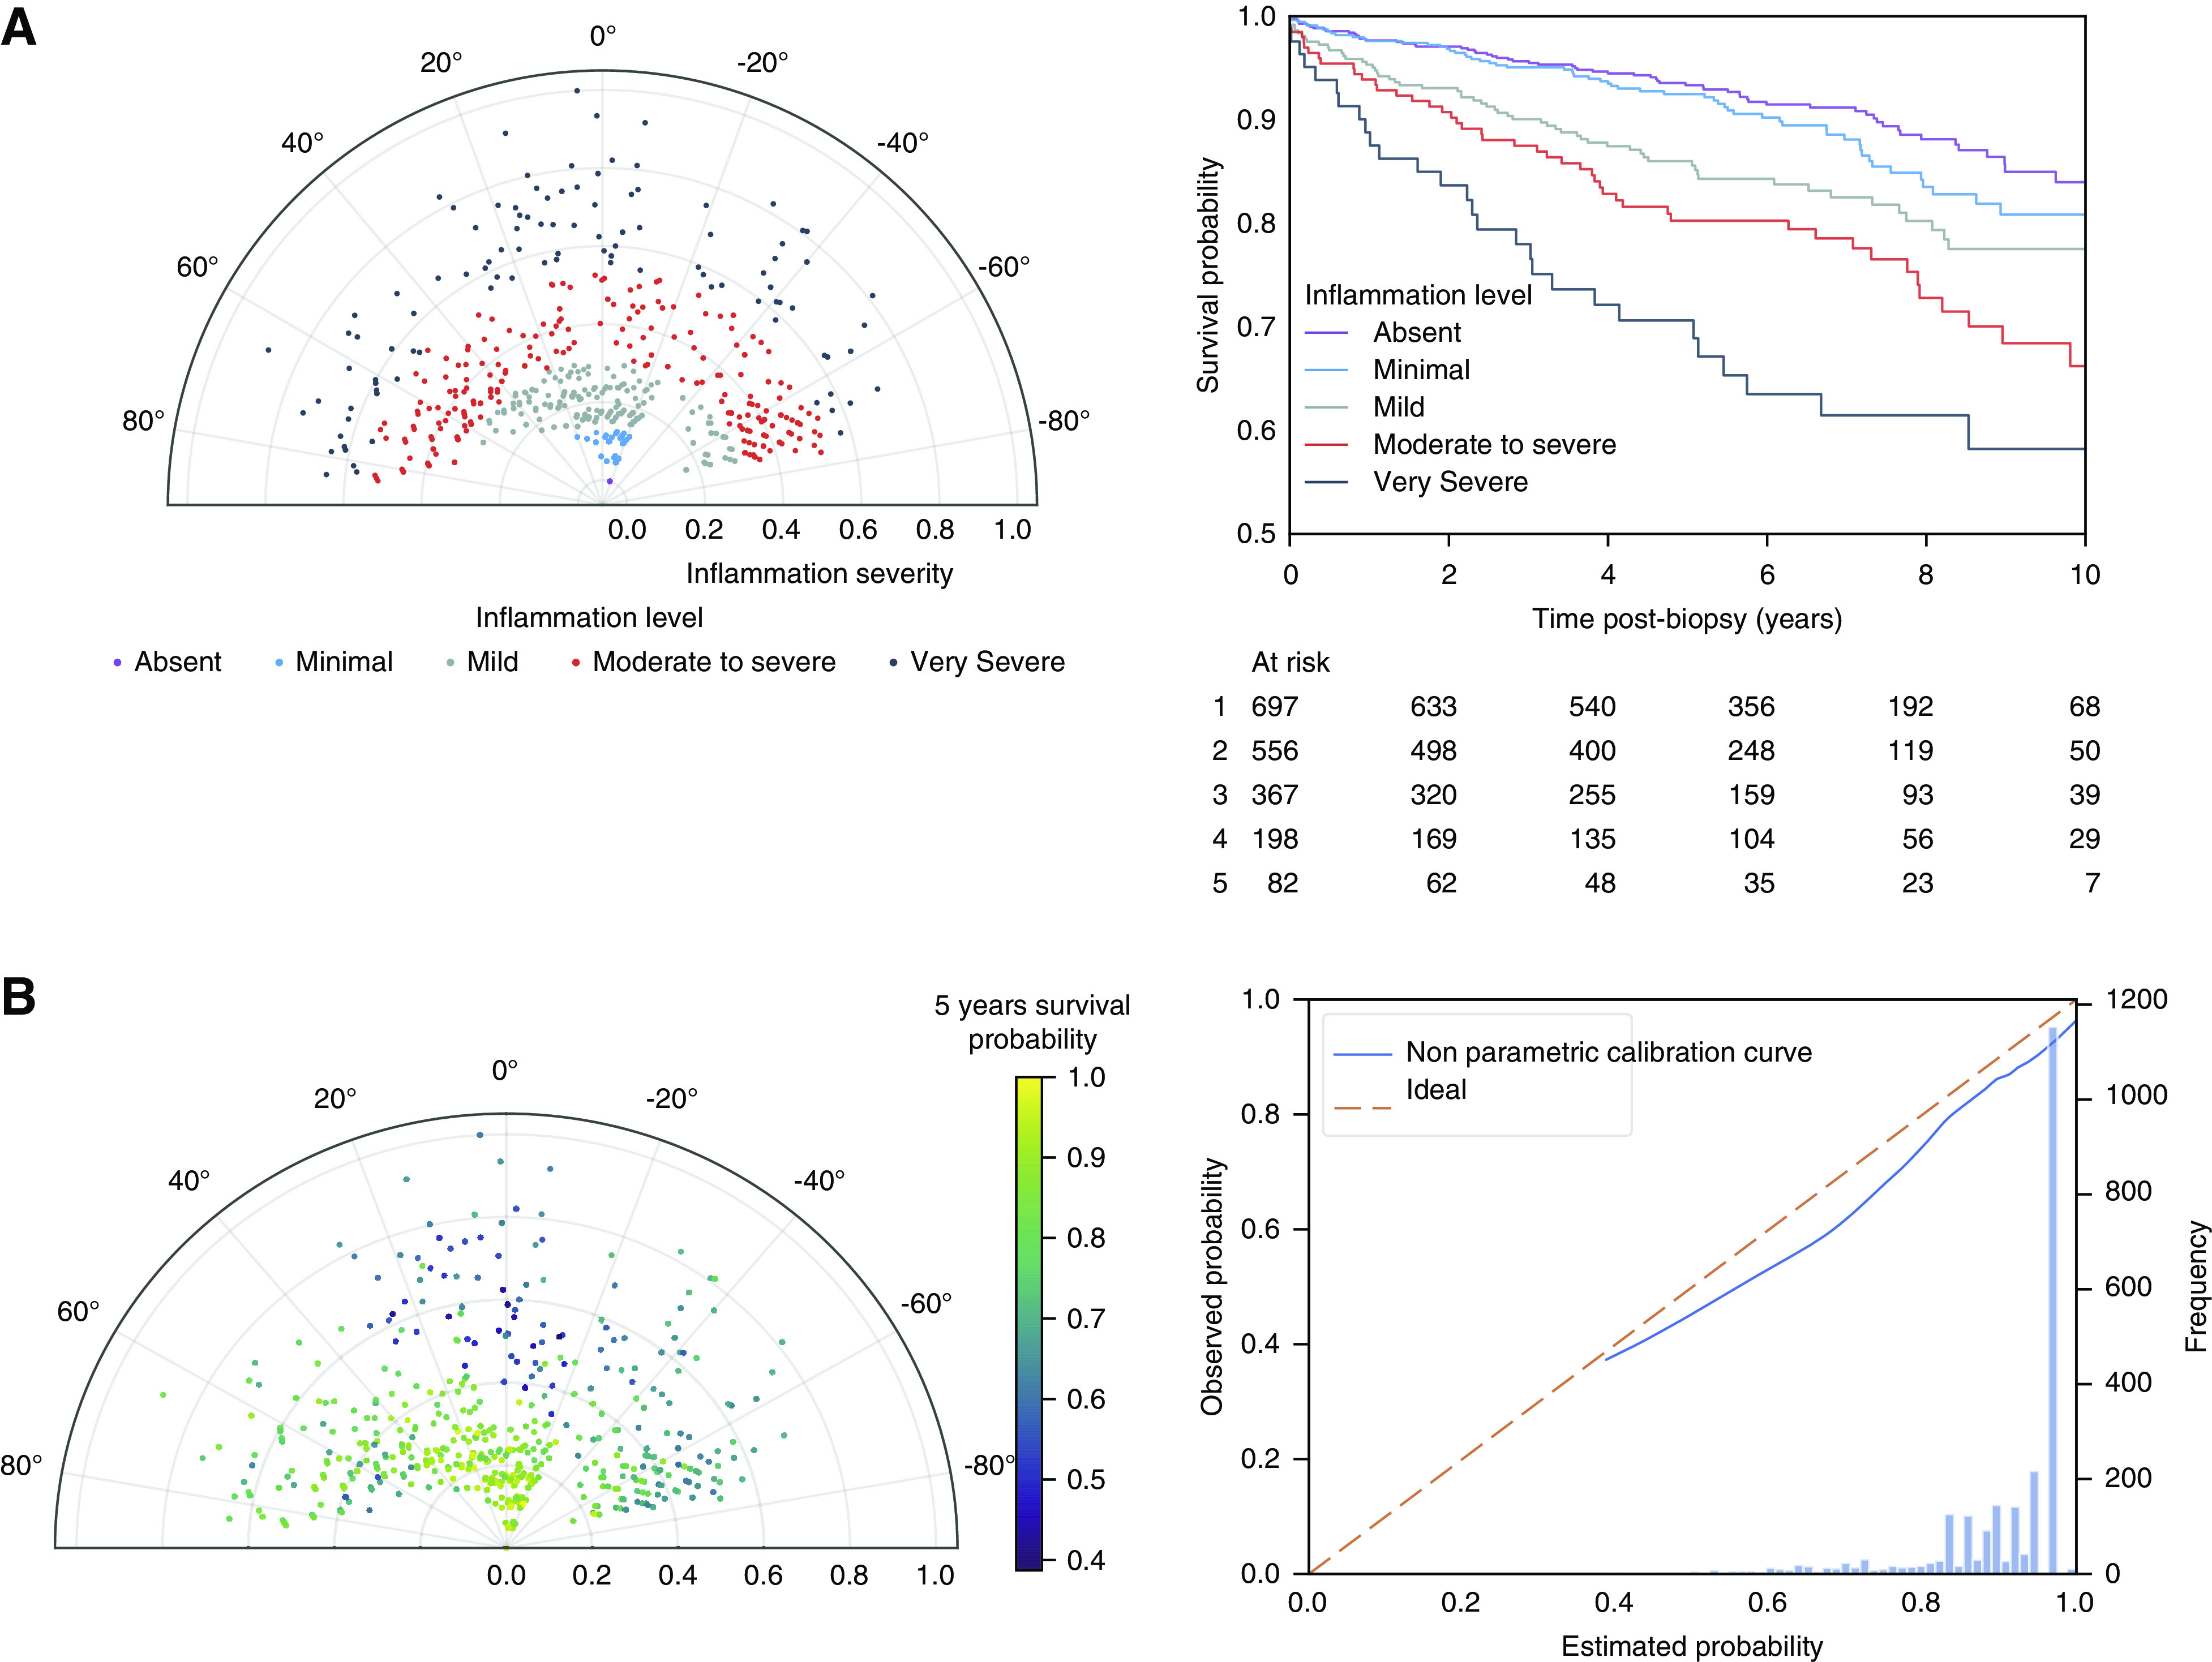
Figure 3.

Association with graft survival in the polar plot visualization tool. (A) Association of the polar plot radius with graft survival in the derivation cohort. We stratified the 3510 biopsies along the radius axis in five strata and plotted the corresponding Kaplan-Meier survival curves. This demonstrates that the radius of the polar plot, which represents the extent of inflammation (the sum of the reweighted acute lesions scores, scaled to the unit interval from 0 to 1) is positively associated with the risk of graft failure. The different levels of inflammation correspond to the following radius: “No inflammation”: radius 0.00–0.04; “Minimal inflammation”: radius 0.04–0.10; “Mild inflammation”: radius 0.10–0.24; “Moderate to severe inflammation”: radius 0.24–42; and “Very severe inflammation”: radius 0.42–1.00. (B) Estimated graft survival probability at 5 years postbiopsy, calculated from the nearest neighborhood with k=40 (left panel) with corresponding calibration curve (right panel).
