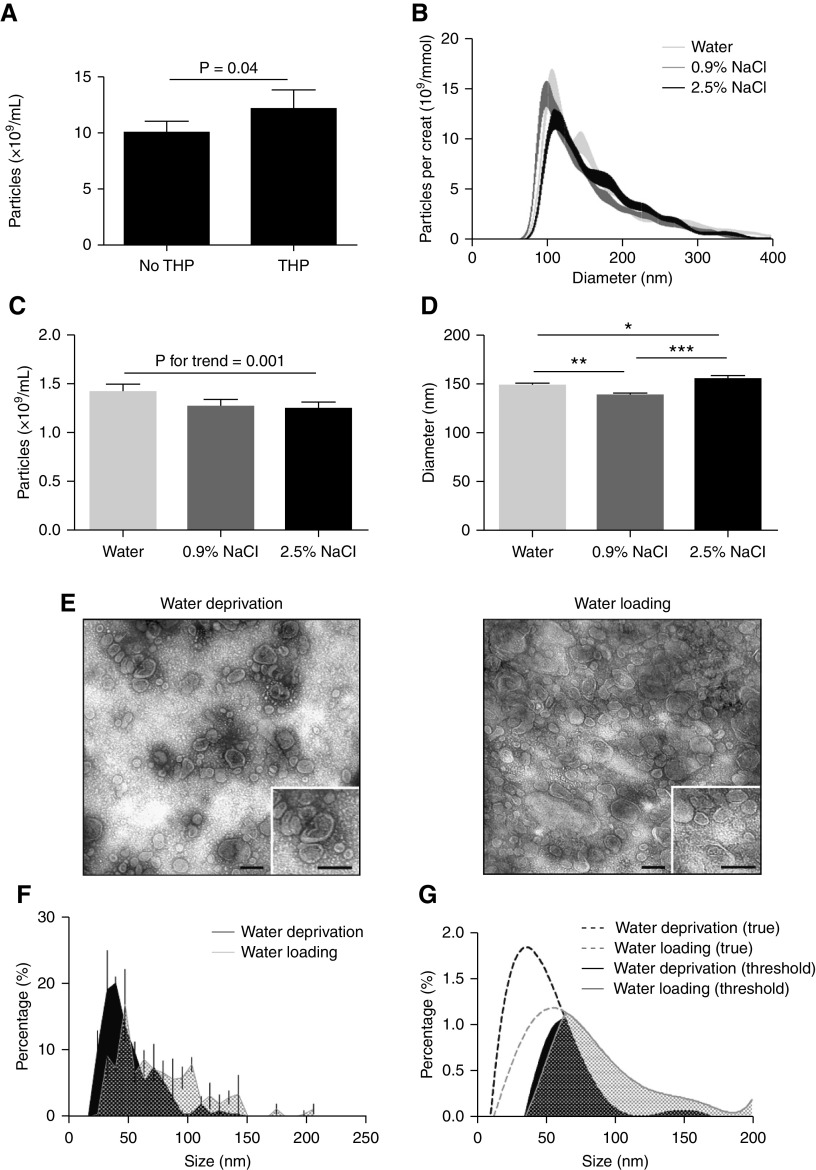
Figure 4.
Effect of THP and urinary concentration on particle count and size. (A) The addition of THP (40 µg/ml) significantly increased particle count by NTA (n=12/treatment). (B) NTA size-distribution graph with different solutions added to whole urine (n=15/treatment). (C) Particle count was significantly lower when solutions with increasing tonicity were added to whole urine (n=15/treatment). (D) Particle size was significantly higher when adding hypotonic or hypertonic solution to whole urine (n=15/treatment; *P<0.05, **P<0.01, ***P<0.001). (E) Representative image of negative staining transmission electron microscopy (TEM) of 200 K pellets from urine sample during water deprivation (T1, left panel) and directly after water loading (W1, right panel). The black bar represents 100 nm. (F) TEM size distribution of double membrane vesicles of water deprivation and water loading samples (n=4 per time-point, per 8 nm size bin±SEM). Analysis was performed by mixed linear model. (G) Polynomial model on the basis of TEM size distribution, with an arbitrary linear threshold between 35 and 65 nm representing the possible threshold of NTA. Areas under the curves were used to determine the percentage of uEVs that are missed with this threshold (per 1 nm size bin).

