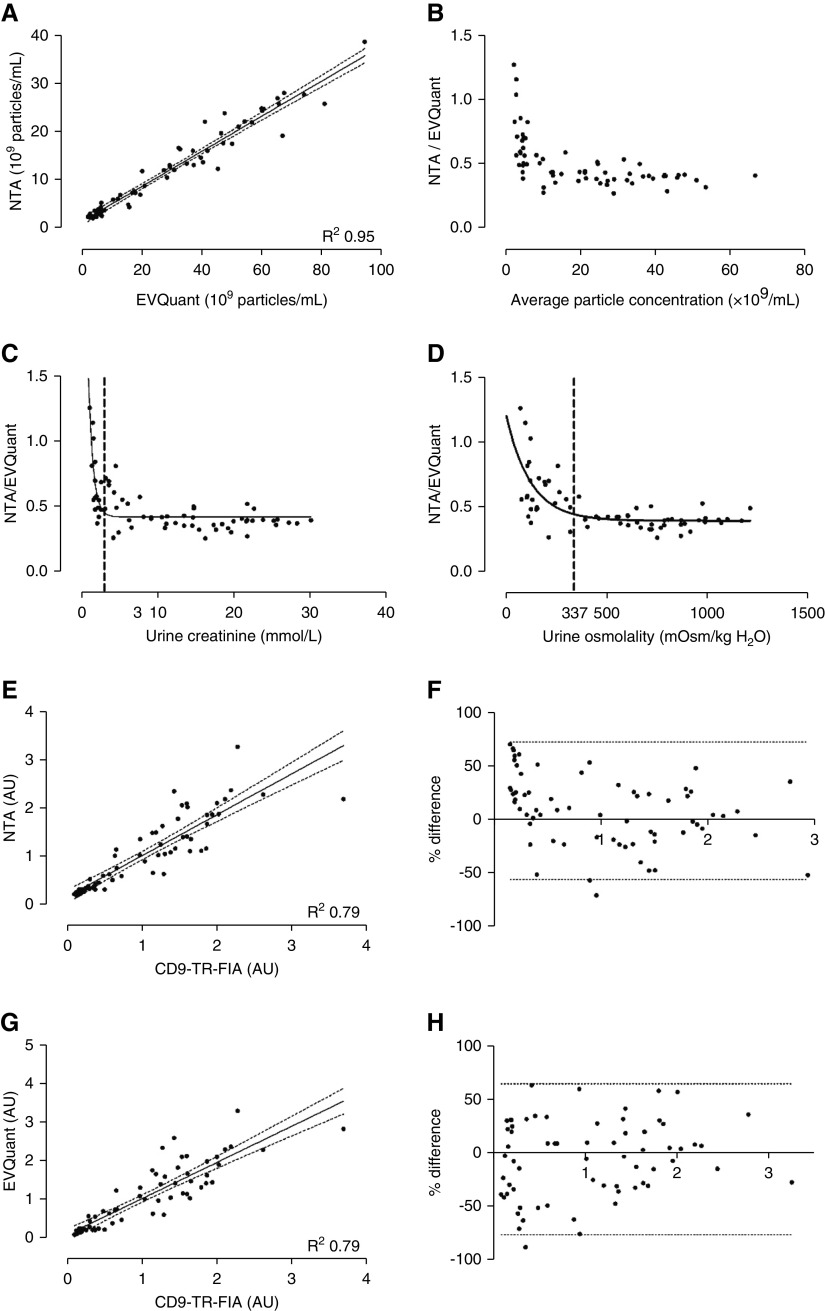
Figure 5.
Comparison of three whole urine uEV quantification techniques. NTA, EVQuant, and CD9–TR-FIA were compared using the urine samples from the water-loading study (n=66). Correlation (A) and Bland-Altman plot (B) of particle concentrations measured by EVQuant versus NTA. Limits of agreements are not shown because of the severe skewing (P<0.001) at low concentrations. (C) Ratio of particles as measured by NTA versus EVQuant in relation to urinary creatinine and (D) osmolality, with representation of the deflection points, to determine at which urine creatinine concentration or urine osmolality skewing starts (dashed lines). (E) Correlation and (F) Bland-Altman plot of urinary particle concentrations measured by NTA versus TR-FIA. Correlation (G) and Bland-Altman plot (H) of EVQuant versus CD9–TR-FIA. In the Bland-Altman plots, limits of agreements are shown by the dotted lines. AU, arbitrary units.

