Figure 8.
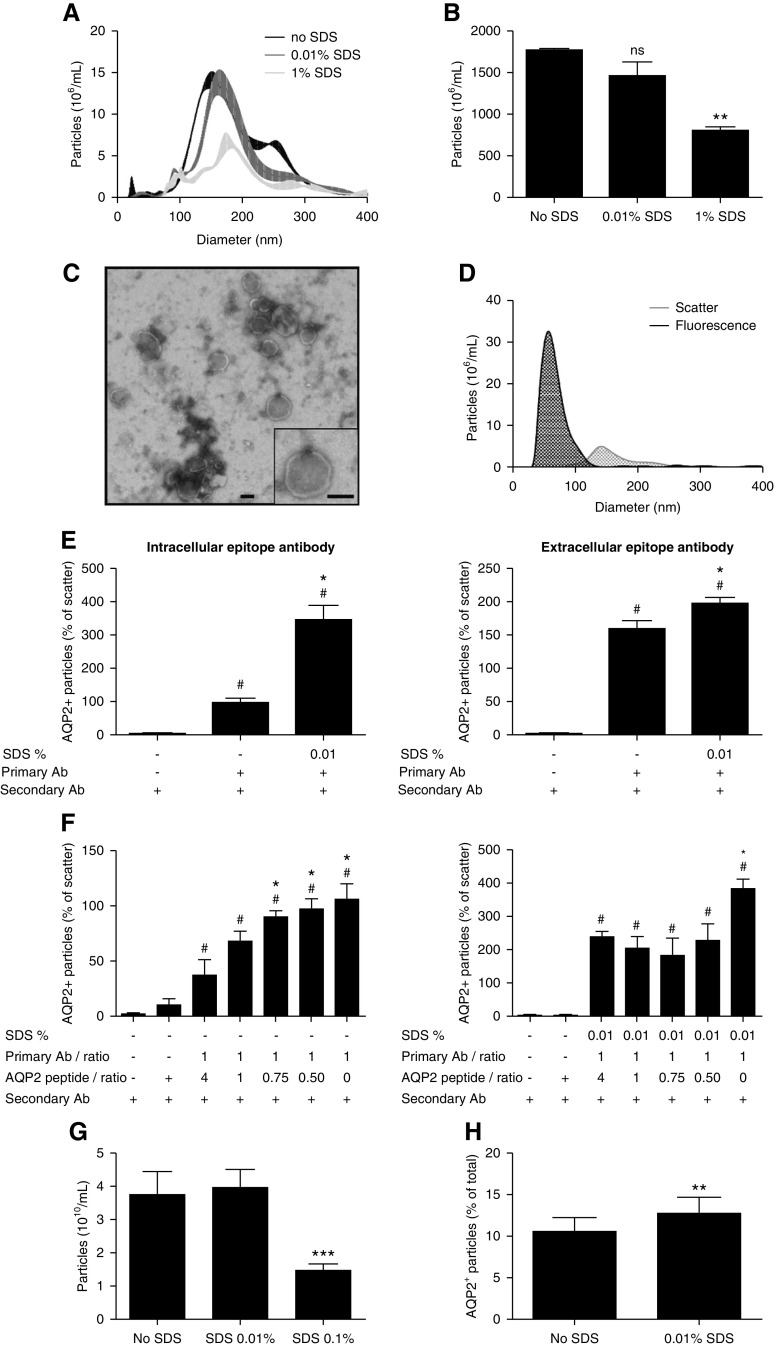
Use of detergent to enhance intracellular epitope recognition. (A) NTA size distribution graph of whole urine samples without SDS and treated by 0.01% v/v or 1% v/v SDS (n=3/treatment). (B) NTA particle counts without SDS, with 0.01% v/v or 1% v/v SDS (n=3/treatment, **P<0.01 versus no SDS). (C) Representative TEM image of 0.01% v/v SDS-treated 200 K pellets. The bar represents 100 nm. (D) Fluorescence NTA-based representative size distribution of uEVs treated with 0.01% v/v SDS versus controls using a NanoSight NS300 in fluorescence mode (AQP2–488) and in scatter mode. (E) Use of intracellular-epitope and extracellular-epitope AQP2 antibodies to determine the percentage of AQP2+ particles (relative to particle count in scatter mode) without SDS and with 0.01% v/v SDS (n=3–7/treatment). See Supplemental Figure 11 for characteristics of the extracellular-epitope AQP2 antibody. To determine the background noise, urine samples were also treated with only secondary antibody (n=3–6). # P<0.05 versus secondary antibody only, *P<0.05 versus primary and secondary antibody without SDS. (F) AQP2 antibody and anti-AQP2 peptide inhibition experiment in the absence of SDS (left panel: intracellular-epitope antibody, right panel: extracellular-epitope antibody, n=3–4/treatment, * and # P<0.05 versus 1:4 ratio and anti-AQP2 peptide + secondary antibody, respectively). (H) extracellular-epitope AQP2 antibody and anti-AQP2 peptide inhibition experiment in the presence of 0.01% v/v SDS (n=3–4/treatment, * and # P<0.05 versus 1:4 ratio and anti-AQP2 peptide + secondary antibody, respectively). (G) Particle counts by EVQuant of urine samples without SDS, with 0.01% SDS or 0.1% SDS (n=15/treatment, ***P<0.001 versus no SDS). (H) Percentage of EVQuant-detected particles that colocalized with AQP2-Alexa488 nm in urine samples without SDS versus 0.01% SDS (n=15/treatment, **P<0.01).

