
Figure 1.
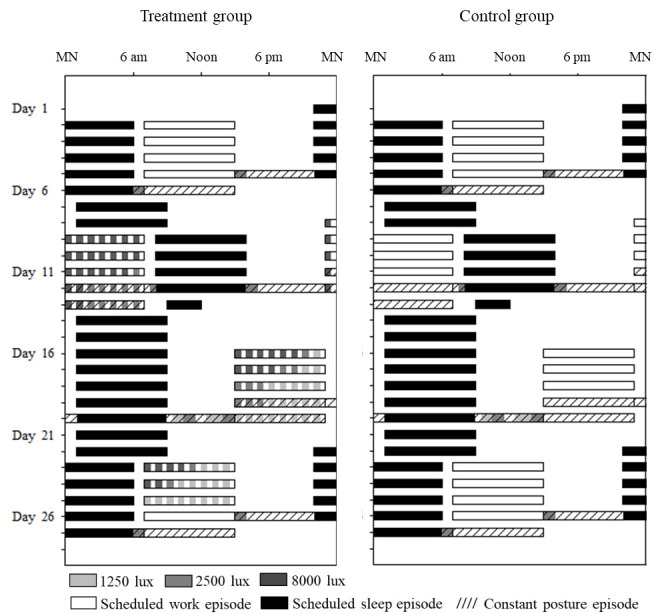
Single raster plots of the 4-week counterclockwise shift work protocols for the treatment and control groups. Clock hour is indicated across the x-axis and study day along the y-axis from top to bottom. Black bars indicate scheduled sleep episodes at home [except during constant postures (CP) where the sleep episodes occurred in the laboratory]. Open bars indicate work shifts under various light exposures (room light 100 lux, 1250 lux, 2500 lux, and 8000 lux). Hashed bars represent CP circadian phase estimation procedures on the 4th/5th work shift at the end of each week. Participants were outside the laboratory at all other times.