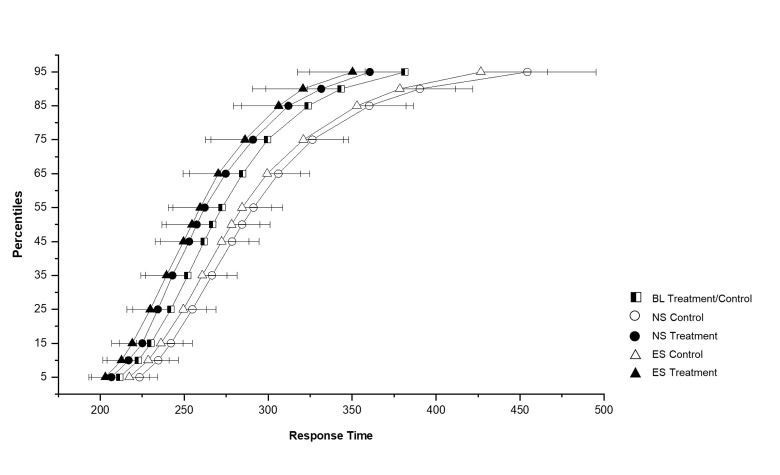
Figure 4.
Cumulative response time distributions of the control (N=10) and treatment (N=7) groups on the baseline, night, and evening shift constant postures (CP). The x-axis represents response time in milliseconds. The y-axis represents percentile values of response time. Error bars represent the standard error of the mean. The black/white square symbol represents the combined control and treatment groups at baseline. The control group is represented by open symbols and the treatment group by solid symbols. The night shift is represented by circles and the evening shift by triangles.

