FIG. 4.


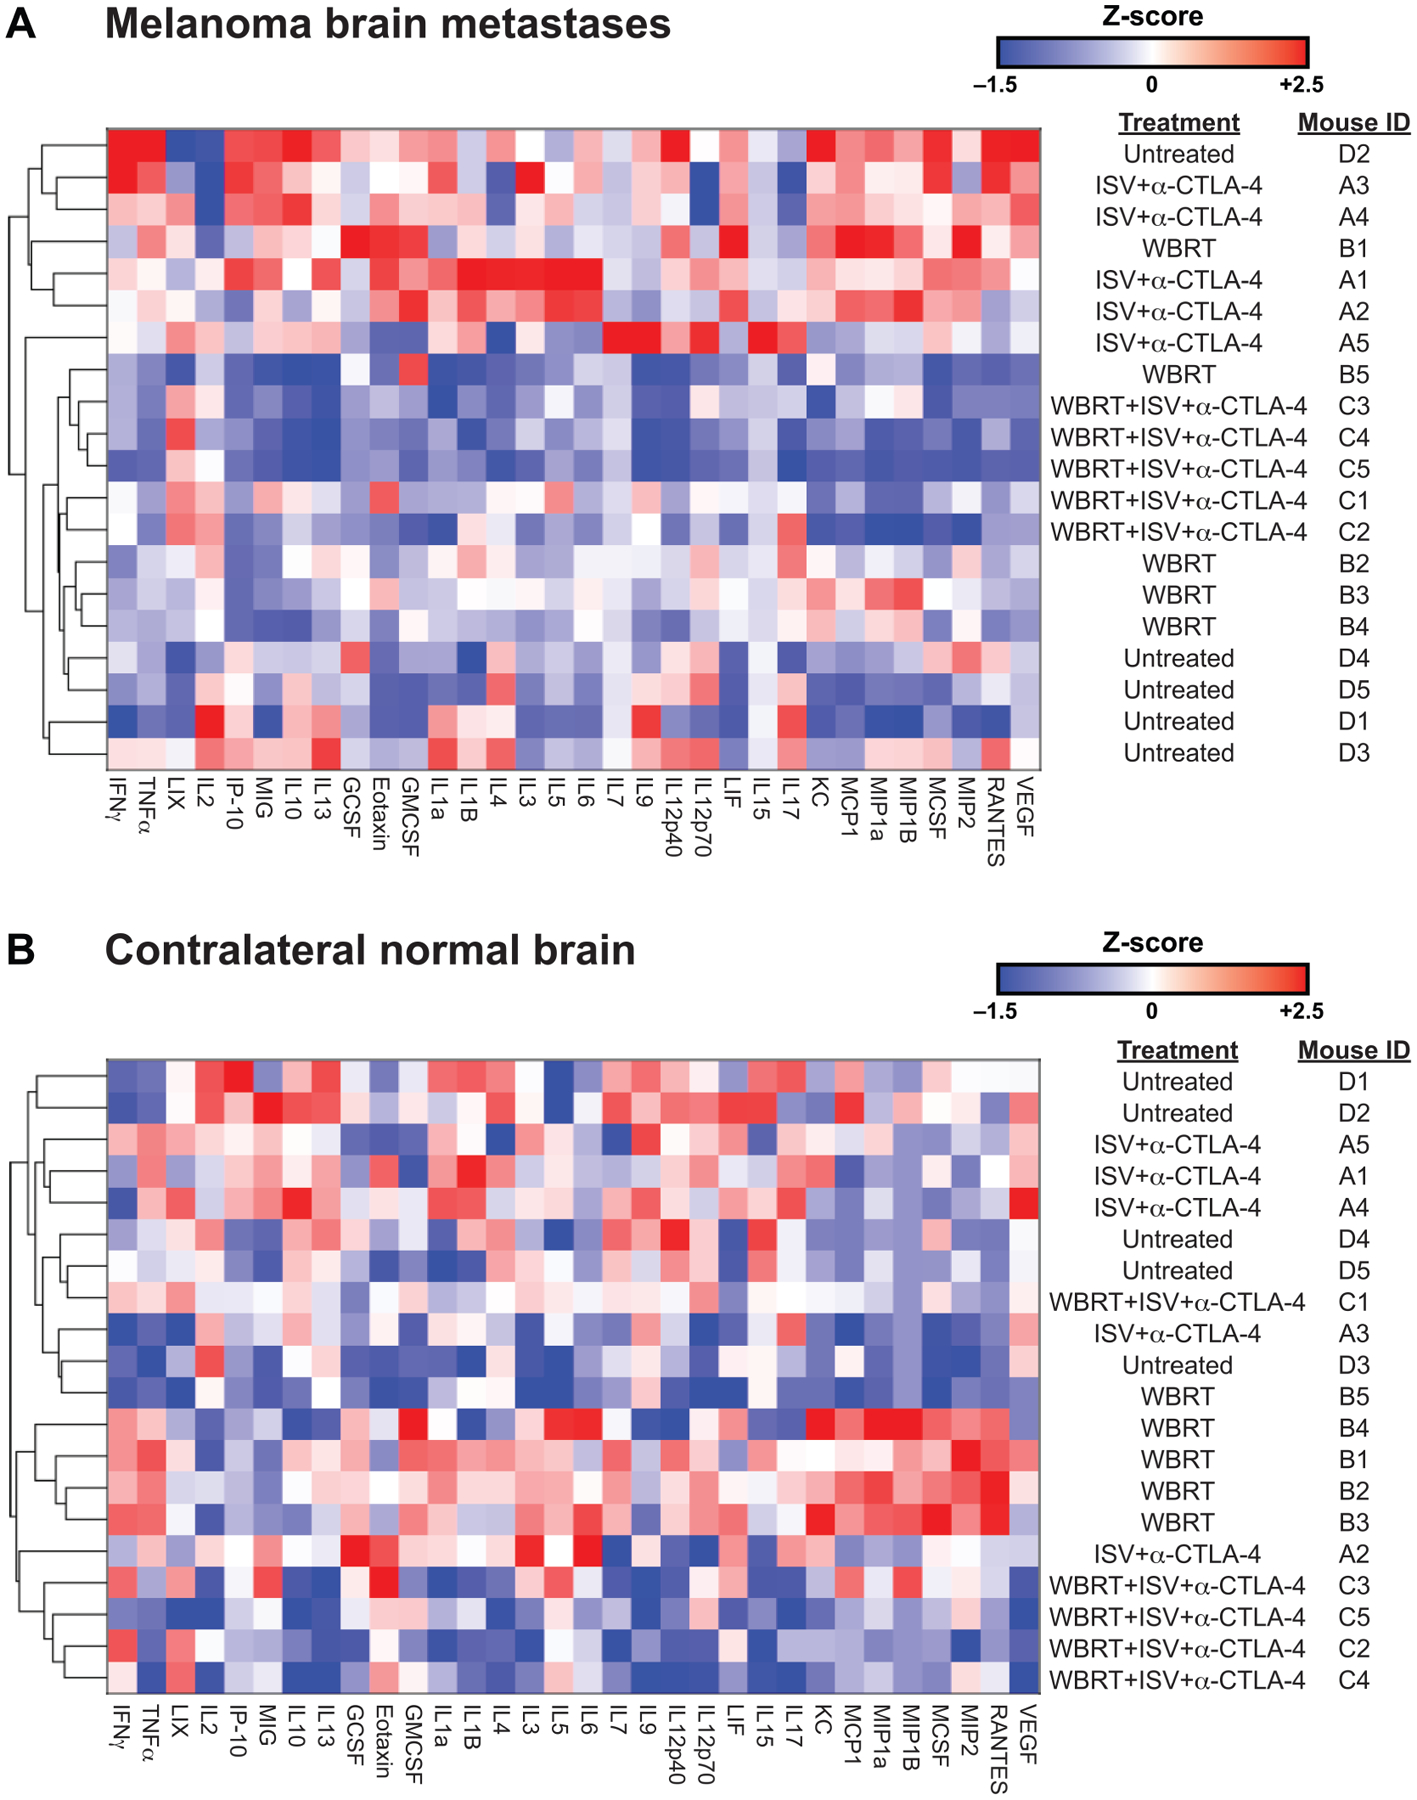
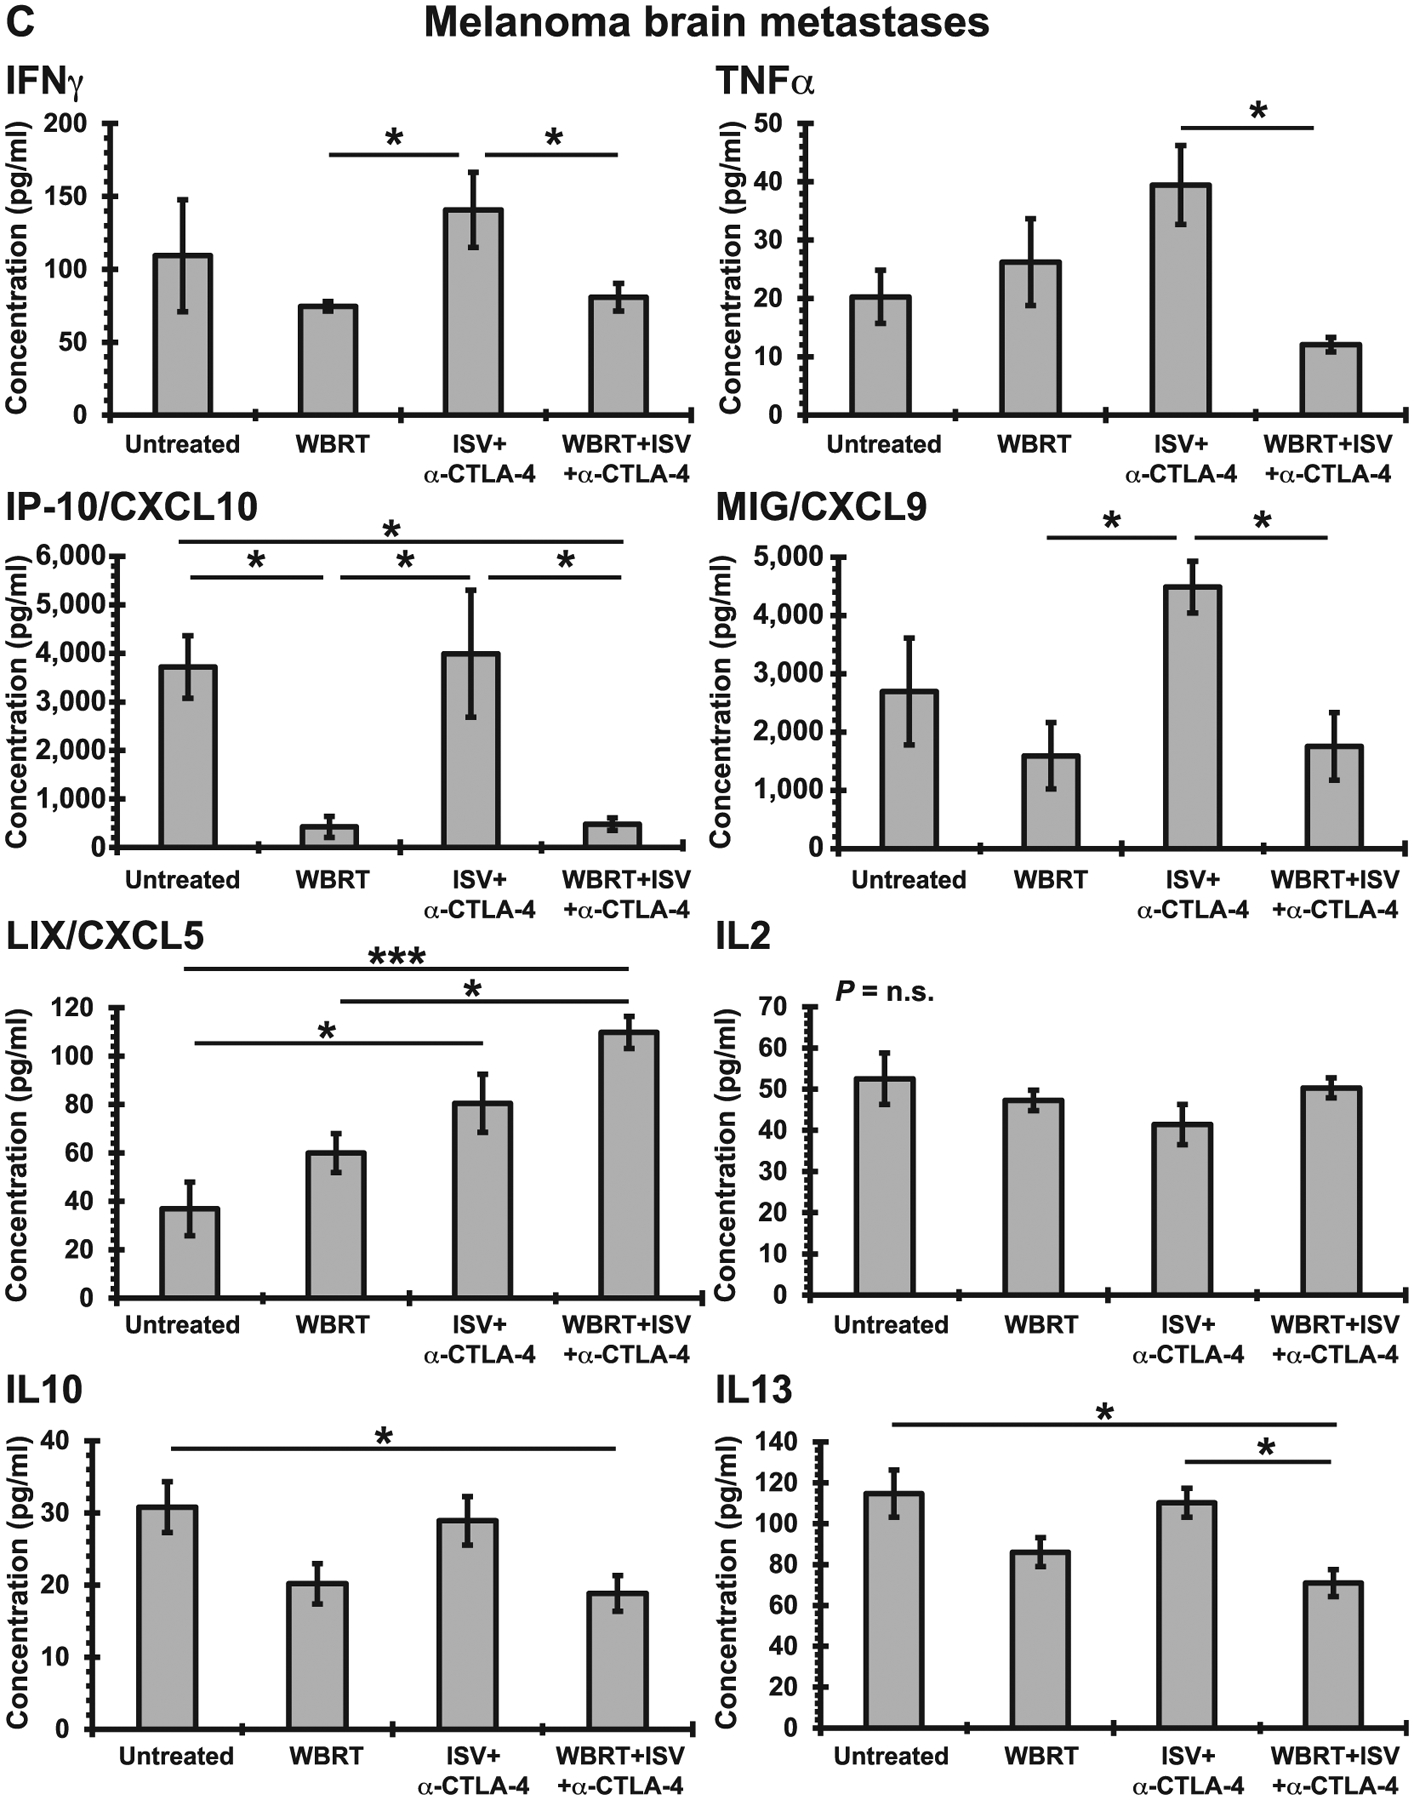
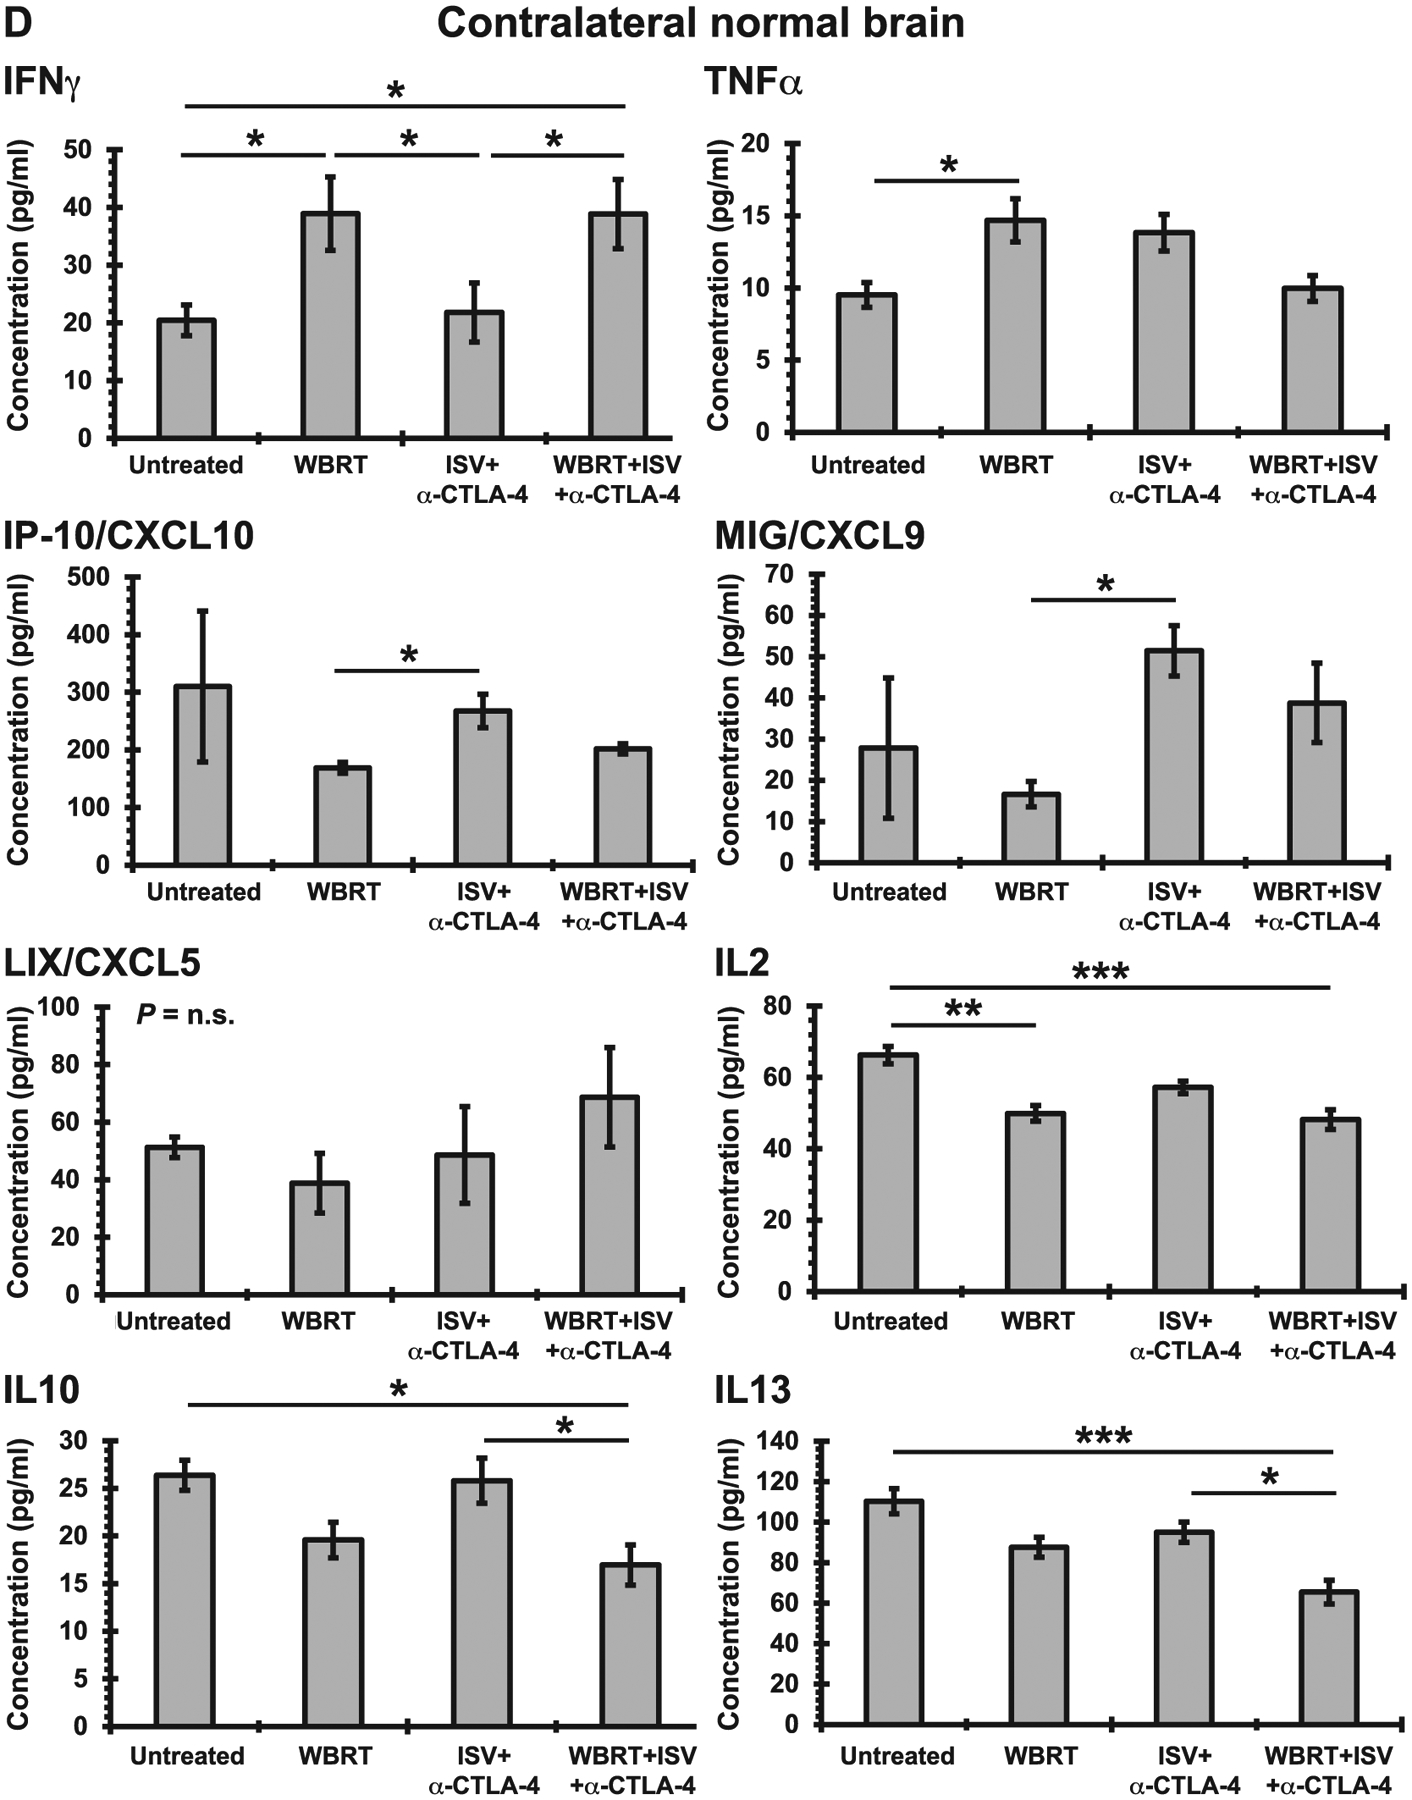
Panel A: Heatmap of cytokines/chemokines analyzed via multiplex immunoassay hierarchically clustered by treatment for both melanoma brain tumors and contralateral normal brain, respectively, in mice that received WBRT + ISV + anti-CTLA-4 regimen and treatment controls (z-scores; n = 5 mice in a single animal experiment). Panels C and D: Concentrations of individual cytokines/chemokines for both melanoma brain tumors and contralateral normal brain, respectively, in mice receiving WBRT ISV + anti-CTLA-4 regimen and treatment controls (***P < 0.001, **P < 0.01, *P < 0.05, mean ± SE, ANOVA with post hoc Bonferroni, n=5 in a single animal experiment).
