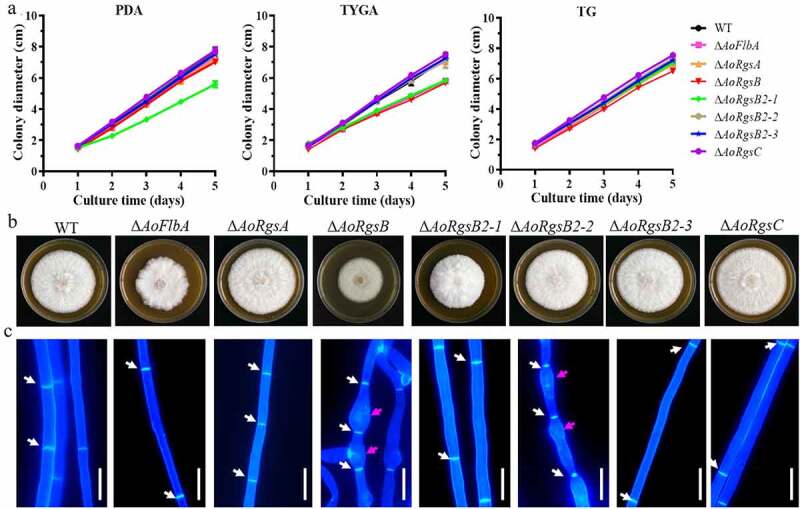
Figure 2.

Comparison of mycelial growth rate, colony morphology, and hyphal development between the WT and ΔAoRgs mutants. A. Comparison of mycelial growth between the WT and mutants on PDA, TYGA, and TG plates. B. Colony morphology of the WT and mutants incubated on TYGA plates for 5 days at 28°C. C. Hyphal septa and cell morphology of the WT and mutants. The hyphal septa and cell morphology were observed after staining with calcofluor white. White arrows: mycelial septa; red arrows: swollen cells. Bar = 10 μm
