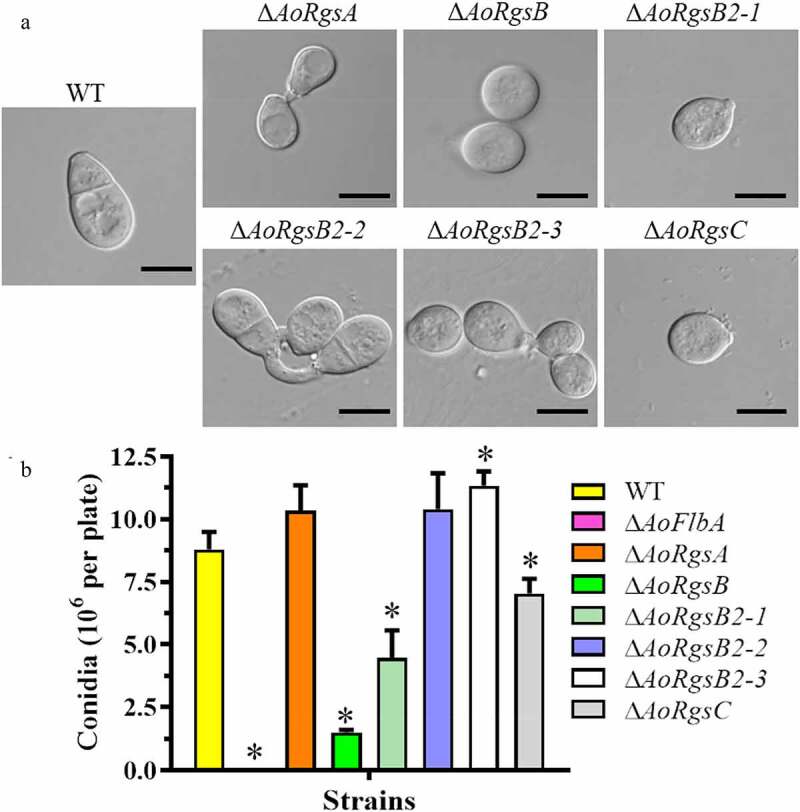
Figure 3.

Comparison of conidial morphology and yields between the WT and ΔAoRgs mutants. A. Conidial morphology of the WT and ΔAoRgs mutants incubated on CMY plates at 28°C for 14 d. B. The conidia yields of the WT and ΔAoRgs mutants. Bar = 10 μm. Error bars: standard deviation, asterisk: significant difference between mutant and WT (Tukey’s HSD, P < 0.05)
