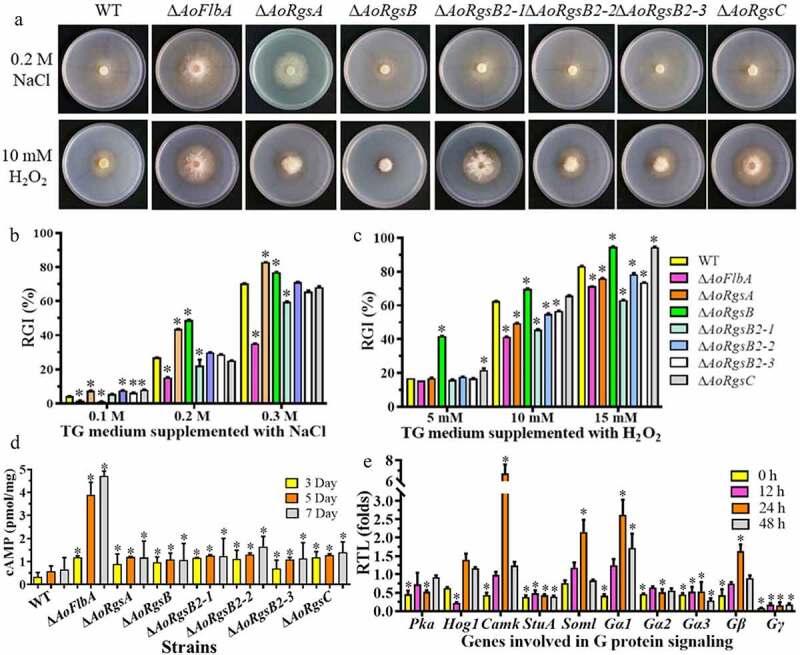
Figure 4.

Comparison of stress resistance, intracellular cAMP levels, and mRNA of G protein signaling components between WT and ΔAoRgs mutants. A. Colony morphologies of the WT and ΔAoRgs mutants after incubation on TG medium containing NaCl and H2O2. B. RGI values of the fungal strains incubated on TG medium containing 0.1–0.3 M NaCl for 7 days. C. RGI values of the fungal strains incubated on TG medium containing 5–15 mM H2O2 for 7 days. D. Intracellular cAMP levels in the hyphae were measured after the WT and ΔAoRgs mutants were cultured in PD broth for 3, 5, and 7 d. E. The relative transcript levels of genes encoding proteins involved in G protein signaling in the WT and ΔAoFlbA mutant. The WT and ΔAoFlbA mutant were incubated in PD broth at 28°C for 7 days. Mycelia were collected and induced by nematodes for 12, 24, 36, and 48 h. Error bars: standard deviation, asterisk: significant difference between the ΔAoRgs mutants and the WT strain (Tukey’s HSD, P < 0.05)
