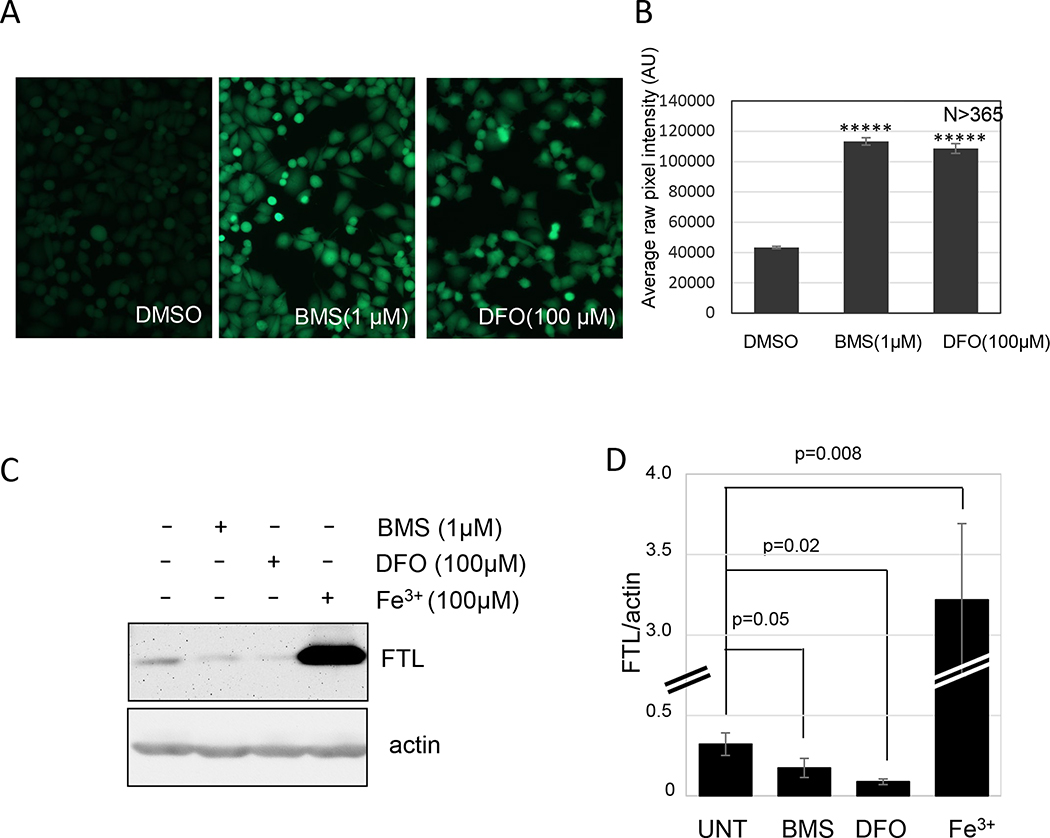
Figure 8.
Iron chelation in cells. (A and B) Effect of BMS536924 on intracellular iron. NCI-H522 cells were exposed to BMS536924 or DFO for 24 hours, and then stained with calcein AM for 15 min. Fluorescent images of live cells shown in (A) were quantified in (B). (C) Effect of BMS536924 and DFO on ferritin light chain (FTL). HT1080 cells were exposed to the compounds indicated for 24 hours and then analyzed by western blotting to measure FTL levels. Images are shown in (D) and pixel intensities from three independent experiments are shown in (C).

