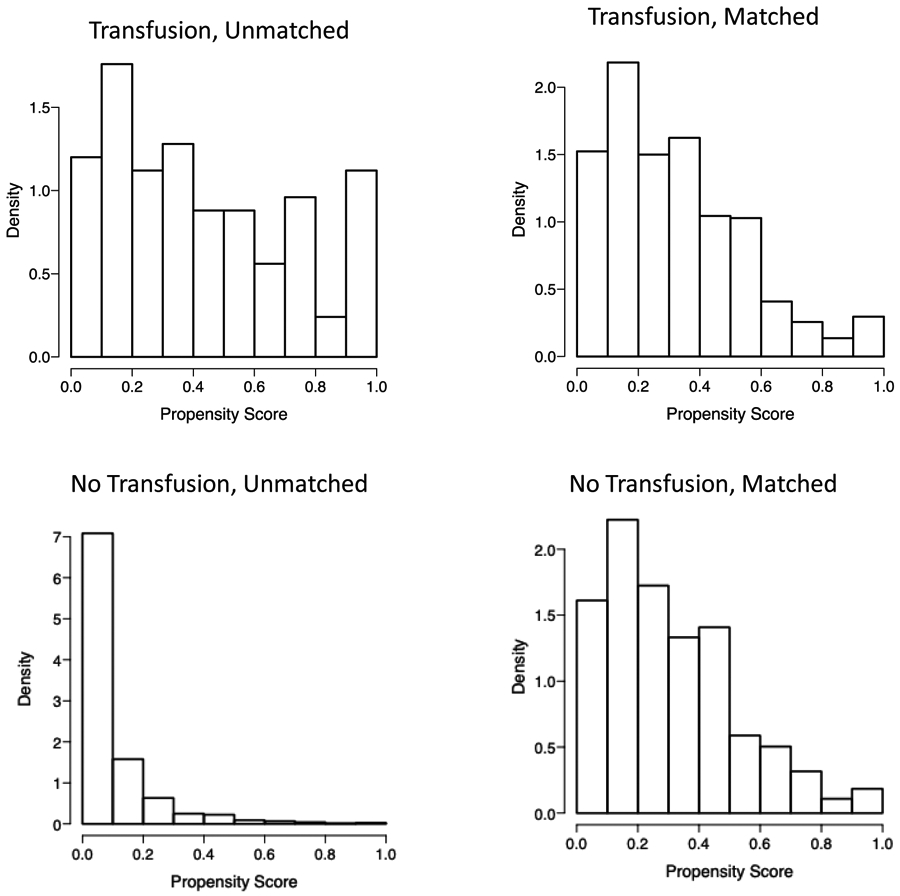
Figure 2: Distribution of Propensity Scores Before and After Matching:

The histograms show the predicted propensity scores by transfusion status. The figures on the left show the propensity scores among all subjects. The figures on the right display the distribution of propensity scores after subjects were matched based on the covariates.
