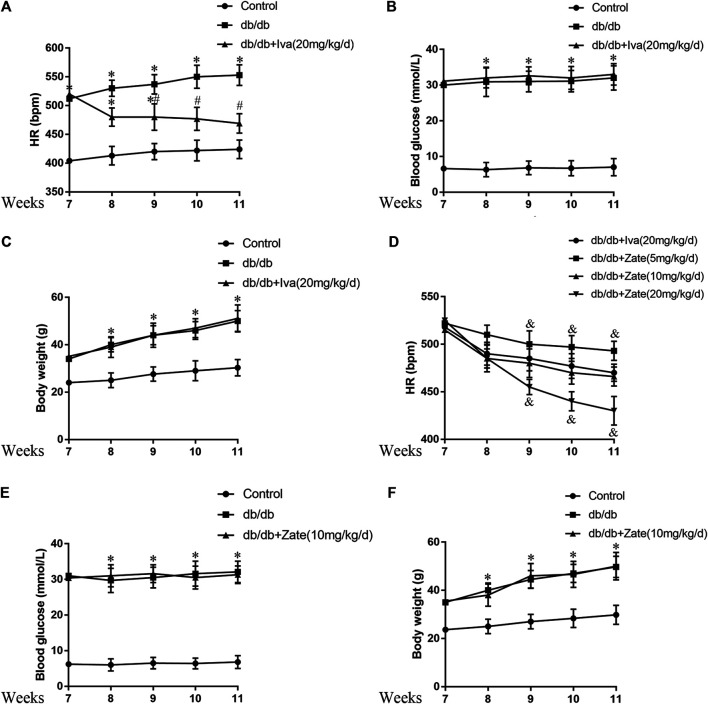
FIGURE 5.
Effects of ivabradine and zatebradine on heart rate (HR) and biometric parameters (A) During treatment with or without ivabradine for 7–11 weeks, the mean HR of mice was recorded by electrocardiography (ECG) (B and C) Mice were treated as described in (A) and their blood glucose concentration and body mass were measured (D) During treatment with ivabradine or zatebradine at the indicated doses for 7–11 weeks, the mean HR of mice was recorded by ECG (E and F) During treatment with 10 mg/kg/day zatebradine for 7–11 weeks, the blood glucose concentration and body mass of the mice were measured. Data are presented as mean ± SEM (n = 8–10). p-values were calculated using one-way ANOVA with Tukey multiple comparison test. *p < 0.05, compared to the Control group; # p < 0.05, compared to the db/db mice group; & p < 0.05, compared to the db/db + Iva (20 mg/kg/d) group or the db/db + Zate (10 mg/kg/d) group.

