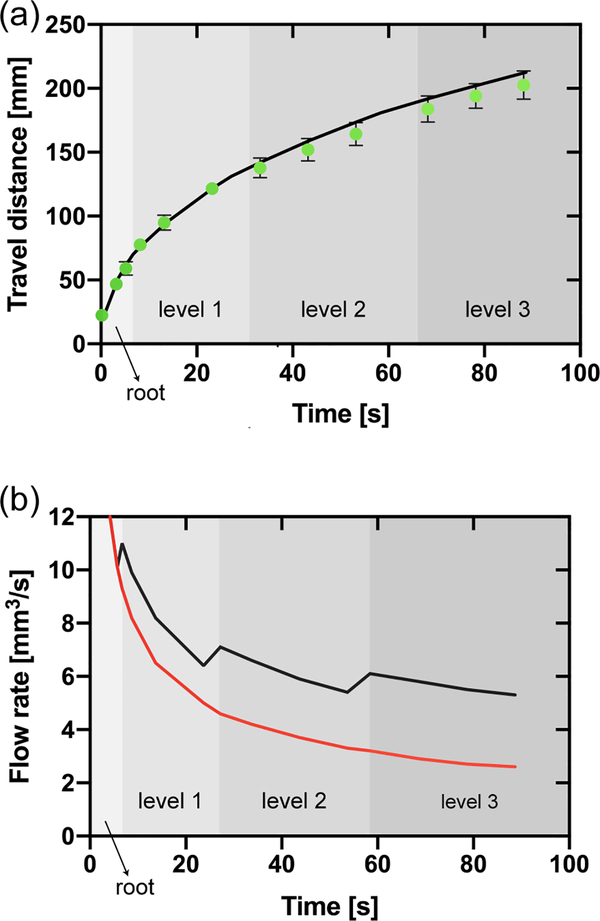
Figure 8.
(a) Travel distances in the homothetic bifurcating capillary tree vs. time (corresponding to equation 25 and to the design shown in Figure 7). The green dots correspond to the experimental travel distances (average of three replicates and error bars are standard deviation of the mean), and the black line to the theoretical model (equation 25). (b) Comparison between the flow rate in the root channel in the homothetic bifurcating capillary tree (black line) and in a single channel (red line) based on the theoretical model (equation 18 modified for 25). The shading in the figure only applies to the black line and indicates the position of the fluid front within the capillary tree corresponding to the flow rate in the root channel (black line). Jumps in the flow rate are due to the crossing of the flow through bifurcations. These jumps are nearly instantaneous, but the time step of the calculation smears somewhat the jumps.

