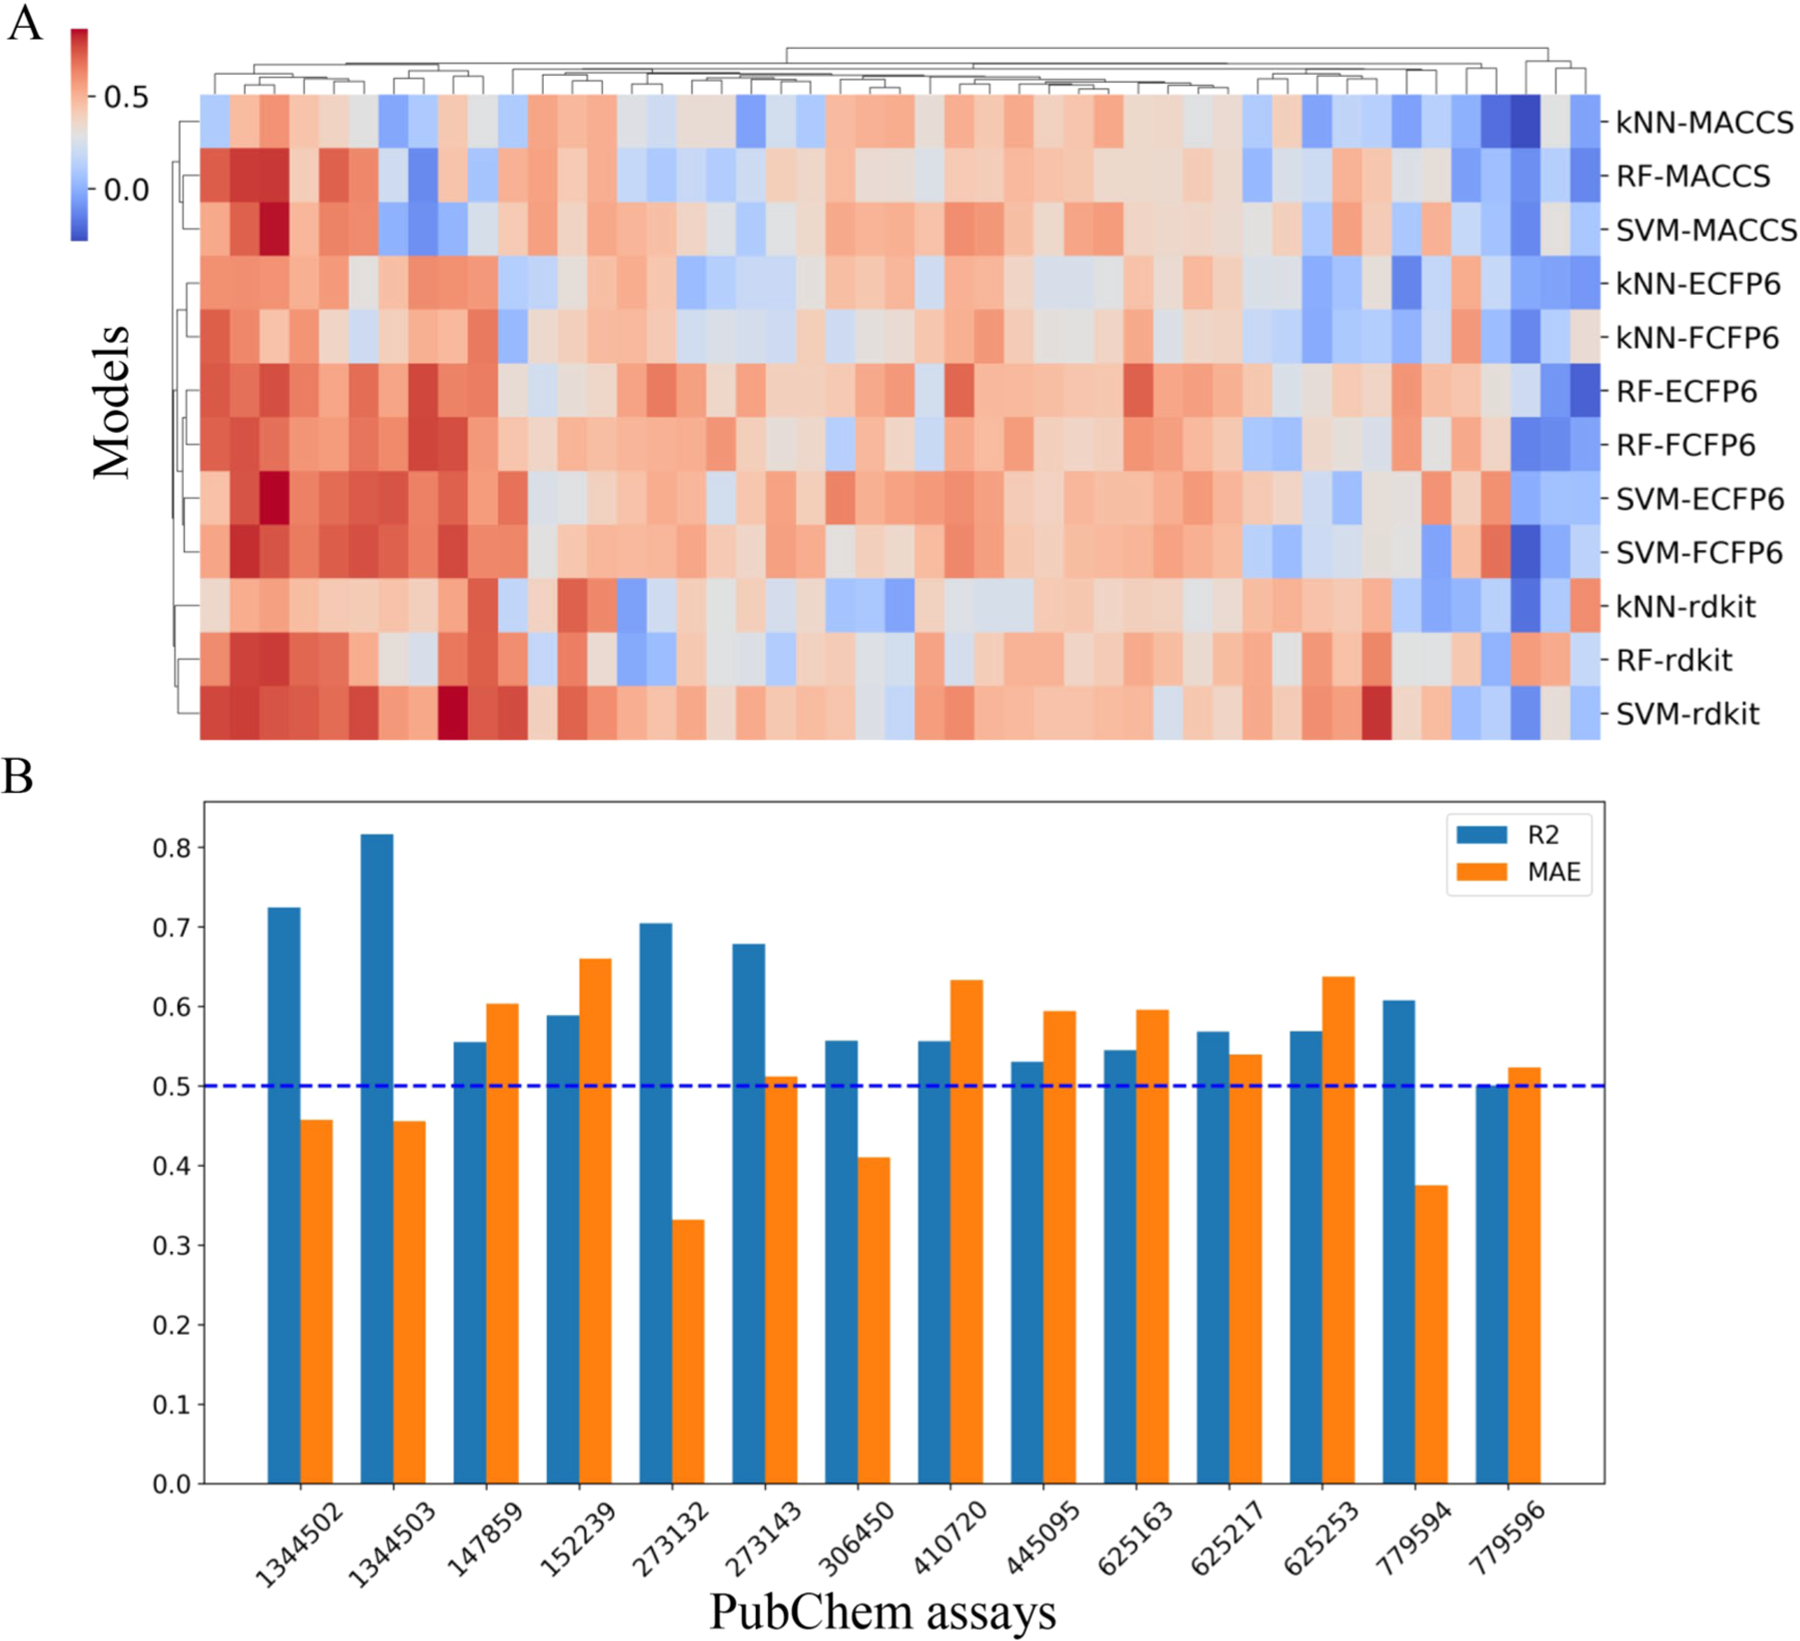
Figure 2.

Performance of QSAR models. (A) Heatmap of 5-fold cross-validation R2 values of models developed for 47 bioassays. (B) R2 and MAE values of the best performance models (model with highest R2) for the 14 selected bioassays.

Performance of QSAR models. (A) Heatmap of 5-fold cross-validation R2 values of models developed for 47 bioassays. (B) R2 and MAE values of the best performance models (model with highest R2) for the 14 selected bioassays.