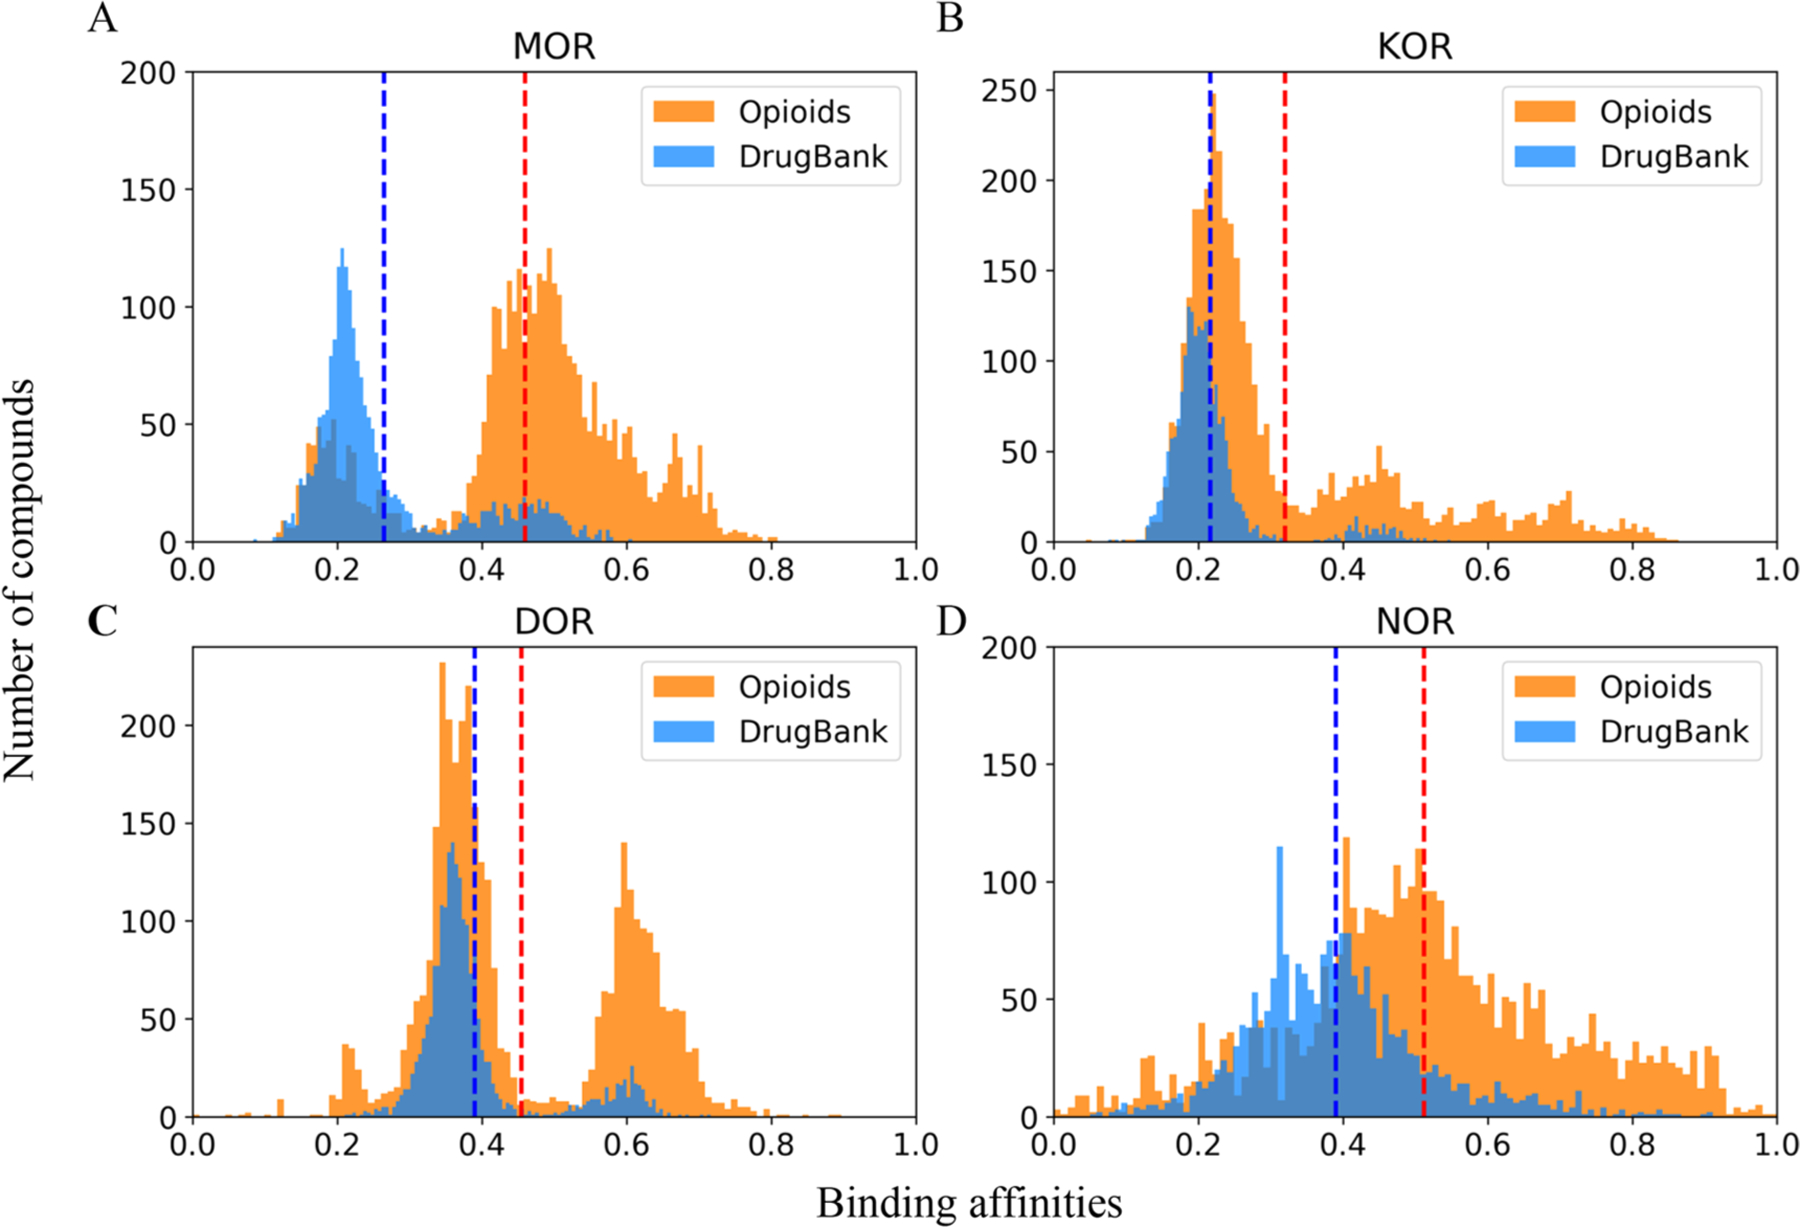
Figure 4.

Distribution of the predicted averaged affinities of opioids and DrugBank molecules to four opioid receptors: (A) MOR, (B) KOR, (C) DOR, and (D) NOR. For compounds in the probe data set and DrugBank data set, the predicted pKi or pIC50 range was normalized to [0,1]. Normalized predictions for the same receptor were averaged, and their distributions are shown. Red and blue dashed lines indicate the mean prediction values of opioids and DrugBank molecules, respectively.
