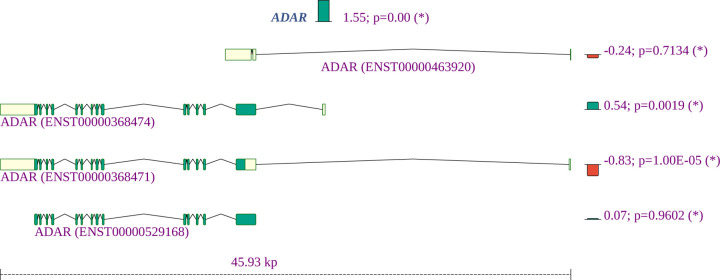
Figure 9:
Summary of the gene expression and splicing profile of ADAR in COVID-19 patient samples. The expression of ADAR was increased by a factor of 21.55 = 3.1. The proportion of isoforms containing two Z-DNA binding domains are increased, whereas an isoform expressing one such domain is decreased.

