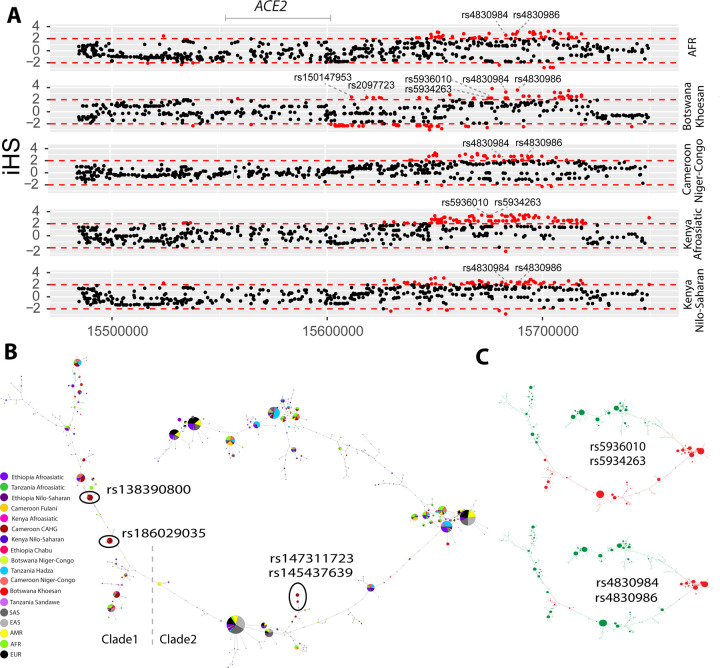
Figure 3. Natural selection signatures at the upstream region of ACE2 in African populations.
(A) iHS signals at the upstream region of ACE2 (chrX:15650000-15720000) in African populations. Each dot represents a SNP. Red dots denote SNPs that are significant (|iHS|>2). The gray solid line denotes the gene body region of ACE2. Putatively causal tag SNPs were annotated in the plots. (B) Haplotype network over 150kb flanking ACE2 in diverse ethnic populations. The network was constructed with SNPs that showed iHS signals in all populations and overlapped with DNase regions or eQTLs. The four functional candidates identified in Cameroon CAHG were also included in the networks. Each pie represents a haplotype, each color represents a geographical population, and the size of the pie is proportional to that haplotype frequency. In the left panel, dashed line denotes the boundary of clade 1 and clade 2. Black oval denotes haplotypes containing the corresponding variants. (C) Haplotype containing variants (rs5936010, rs5934263, rs4830984 and rs4830986) are highlighted. Red pie denotes haplotypes containing the derived allele of the corresponding variants, while green pie denotes haplotypes containing the ancestral allele of the corresponding variants

