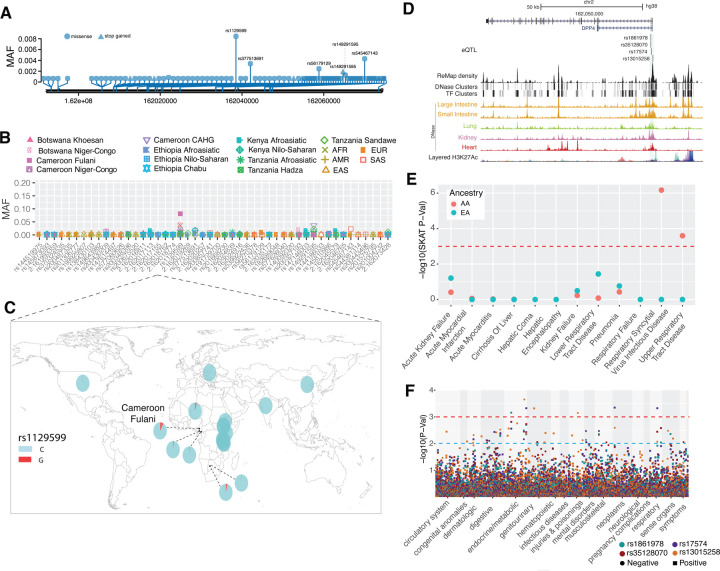
Figure 6. Genetic variation at DPP4 and its disease association.
(A) Location of coding variants and their minor allele frequency (MAF) at DPP4 identified from the pooled dataset. (B) MAF of coding variants in diverse global ethnic groups. (C) The MAF of variant within rs129559 at DPP4 in diverse global ethnic groups. (D) Regulatory eQTLs located in DPP4. RNA Pol2 ChIA-PET data and DNase-seq data of large intestine, small intestine, lung, kidney and heart are from ENCODE 32. (E) Gene-based association result between coding variants at DPP4 and 12 disease classes. The disease classes are shown on the x-axis and the y-axis represents the p-values. EA, European Ancestry; AA, African American ancestry. (F) PheWAS plot of the four eQTLs associated with DPP4 and ~1800 disease codes across 17 disease categories. The disease categories are shown on the x-axis and the y-axis represents the −log10 of the p-values. The colored dot represents an eQTL and the direction of effect of the association. The red dashed line denotes the 0.0001 cutoff, and the blue dashed line represent the 0.001 cutoff.

