
Figure 2. Natural selection signatures at ACE2 in the Cameroon CAHG populations.
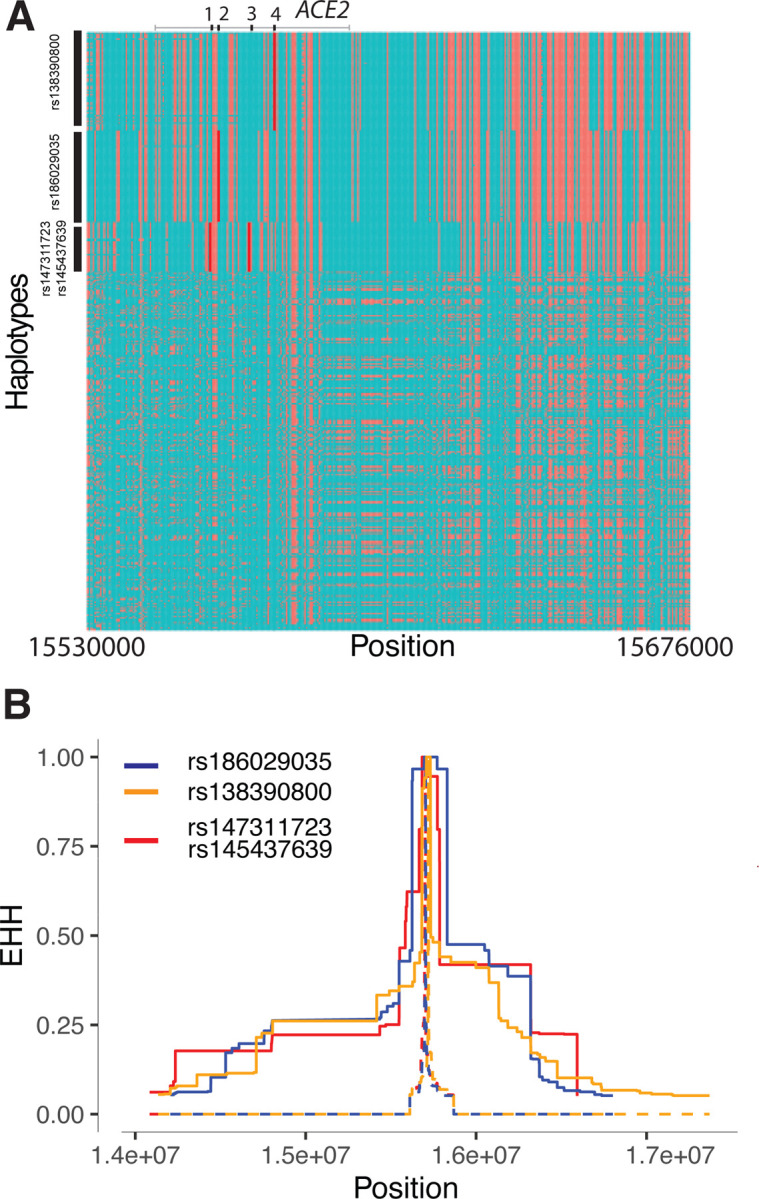
(A) Haplotypes over 150kb flanking ACE2 in CAHG populations. The X-axis denotes genetic variant position, and the y-axis represents haplotypes. Each haplotype (one horizontal line) is composed of the genetic variants (columns). Red dots indicate the derived allele, while green dots indicate the ancestral allele. Haplotypes surrounded by a top-left vertical black line suggest these haplotypes carry derived allele(s) of the labeled variant near the corresponding black line. For example, the first black line denotes all the haplotypes that have the derived allele at rs138390800 (dark red line). Haplotypes carrying rs138390800, rs147311723, rs145437639, and rs186029035 show more homozygosity than other haplotypes. 1, 2, 3, 4 at the top of the plot denotes positions for rs147311723, rs186029035, rs145437639 and rs138390800, respectively. (B) Extended haplotype homozygosity (EHH) of rs138390800, rs186029035 and rs147311723 (rs145437639 is in strong LD with rs147311723) at ACE2 in CAHG populations.