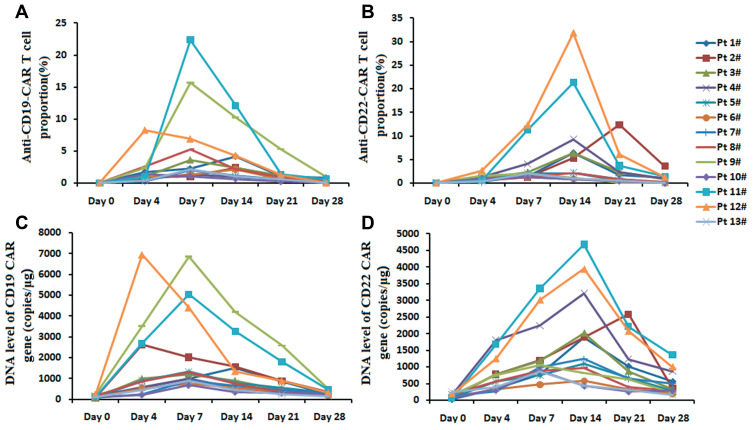
Figure 3.
The proportions of two kinds of CAR-T cells, the levels of two kinds of CAR DNA in peripheral blood. (A and B). The proportions of two kinds of CAR-T cells on 0, 4, 7, 14, 21, 28 days post the CAR-T cell infusion. (C and D). The levels of two kinds of CAR DNA on 0, 4, 7, 14, 21, 28 days post the CAR-T cell infusion.

